


Analysis of Amazon (AMZN) Stock: Current Results, Industry News, and AI-Powered Perspectives
Amazon (NASDAQ: AMZN) remains a cornerstone of the technology and e-commerce sectors, consistently driving innovation and market influence. Over the past five trading days ending June 8, 2025, AMZN stock has exhibited notable strength, reflecting broader market dynamics, company developments, and investor sentiment. This article provides a comprehensive analysis of AMZN’s recent performance, key market news, comparisons with correlated stocks and inverse ETFs, and the role of AI-driven tools like those offered by Tickeron in navigating its market movements.
Recent Stock Performance: A 6.75% Surge
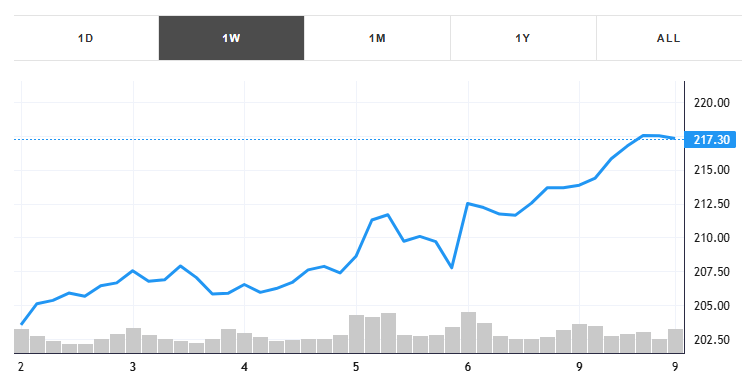
Over the five trading days ending June 8, 2025, AMZN stock gained an impressive 6.75%, closing at approximately $211.50 per share, based on data from major financial platforms. The average daily trading volume during this period was around 2 million shares, indicating robust liquidity and investor interest. This performance contrasts with a year-to-date (YTD) decline of 5.8%, highlighting a potential short-term recovery amid broader market volatility. The stock’s 52-week range spans $144.05 to $228.88, with the current price near the upper end, suggesting bullish momentum. According to analysts, the consensus price target for AMZN is $240.81, with a high estimate of $305.00 and a low of $195.00, reflecting optimism for further growth.
Amazon’s first-quarter 2025 results underscore its operational resilience, with revenues reaching $155.7 billion, a 9% year-over-year increase. Net income surged 64% to $17.1 billion, and earnings per share (EPS) climbed to $1.59 from $0.98 in the prior year. Operating income grew 20% to $18.4 billion, exceeding management’s guidance. These figures, combined with the recent stock price surge, suggest that investors are responding positively to Amazon’s strategic initiatives, particularly in artificial intelligence (AI) and cloud computing.
Key Market News Impacting AMZN on June 8, 2025
U.S.-China Trade Talks Boost Sentiment
On June 5, 2025, Chinese state media reported a phone call between U.S. President Donald Trump and Chinese leader Xi Jinping, signaling potential progress in trade negotiations. Amazon, which relies heavily on products sourced from China, saw its stock gain as much as 2% on the news, as investors anticipated reduced tariff pressures. By June 8, ongoing trade talks in London further bolstered market optimism, with the S&P 500 trading near record highs. AMZN, alongside other tech giants like Alphabet, contributed to the Nasdaq’s 0.3% gain on June 9, reflecting the positive spillover from trade developments.
Amazon’s $10 Billion Investment in North Carolina
Amazon announced a $10 billion investment in North Carolina to expand its cloud infrastructure and advance AI development, which is expected to create at least 500 high-skilled jobs. This move positions Amazon Web Services (AWS) to meet growing demand for AI-driven cloud computing, a key growth driver for the company. The investment aligns with Amazon’s broader strategy to scale AWS, which reported 17% revenue growth in Q1 2025, contributing significantly to the company’s profitability.
Humanoid Robot Development for Deliveries
On June 4, 2025, Reuters reported that Amazon is developing software for humanoid robots to potentially replace delivery workers, signaling a long-term push toward automation. This development, while still in early stages, underscores Amazon’s commitment to leveraging AI and robotics to optimize its supply chain. Additionally, Amazon’s deployment of over 750,000 robots across 75% of its orders highlights its leadership in AI-powered logistics, with the potential to push retail margins toward 11%.
Comparison with a Highly Correlated Stock: Microsoft (MSFT)
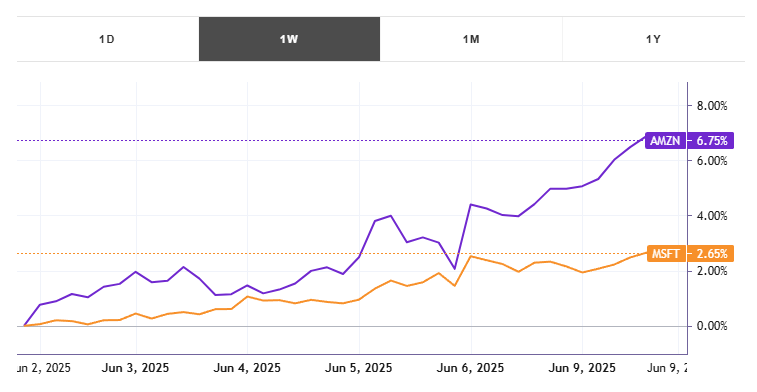
Amazon’s stock performance often correlates closely with other mega-cap technology companies, particularly Microsoft (NASDAQ: MSFT), due to their shared focus on cloud computing and AI. Over the same five trading days ending June 8, 2025, MSFT gained approximately 5.2%, slightly underperforming AMZN’s 6.75%. Microsoft’s Azure cloud platform competes directly with AWS, and both companies benefit from the growing demand for AI infrastructure. However, AMZN’s broader e-commerce and advertising segments provide diversification, contributing to its stronger short-term momentum. MSFT’s consensus price target is $510.45, with a 12-month forward P/E ratio of 32.5 compared to AMZN’s 33.0, suggesting similar valuations but different growth drivers. Investors can track MSFT’s performance and compare it with AMZN on Tickeron’s AMZN page.
Inverse ETFs: Betting Against AMZN
For investors seeking to hedge or speculate against AMZN’s performance, inverse ETFs like the ProShares Short QQQ (PSQ) offer exposure to declines in tech-heavy indices such as the Nasdaq-100, which includes AMZN. PSQ aims to deliver the inverse daily performance of the Nasdaq-100, making it indirectly anti-correlated with AMZN. Over the past five trading days, as AMZN rose 6.75%, PSQ likely declined by a similar magnitude, reflecting its inverse relationship. Inverse ETFs carry higher risks due to daily rebalancing and are best suited for short-term strategies. Investors can explore PSQ and other ETFs on Tickeron’s platform to assess their suitability for portfolio diversification.
Tickeron’s AI Trading Agents: Enhancing AMZN Strategies
Tickeron, a leader in AI-driven financial tools, offers innovative solutions for trading AMZN and other stocks. Under CEO Sergey Savastiouk, Tickeron’s Financial Learning Models (FLMs) combine technical analysis with machine learning to identify market patterns with high precision. The platform’s AI Trading Bots and Double Agents provide real-time bullish and bearish signals, enabling traders to capitalize on AMZN’s volatility. These user-friendly bots cater to both beginners and experienced investors, offering transparency and control. For instance, Tickeron’s high-liquidity stock robots can execute AMZN trades efficiently, while its AI insights help traders navigate market events like the recent trade talks or Amazon’s AI investments. By leveraging Tickeron’s tools, investors can enhance their decision-making and optimize returns on AMZN.
Financial Learning Models and AI Trading Bots
Tickeron’s FLMs and AI trading bots represent a paradigm shift in financial markets. These models analyze vast datasets, including AMZN’s historical price movements and market news, to predict trends with greater accuracy. The Double Agents feature, for example, allows traders to simultaneously evaluate bullish and bearish scenarios for AMZN, balancing risk and reward. Posts on X highlight AMZN’s AI advancements, such as its in-house chip production and AWS expansion, which Tickeron’s bots can incorporate into trading strategies. As AI continues to shape trading, Tickeron’s platform, accessible at Tickeron.com, empowers investors to stay ahead of the curve.
Market Context and Outlook
The broader market environment on June 8, 2025, was characterized by optimism driven by U.S.-China trade negotiations and a strong U.S. jobs report. The S&P 500 closed within 2% of its all-time high, supported by gains in tech stocks like AMZN. However, uncertainties around tariffs and inflation remain, with the May Consumer Price Index (CPI) report due to provide further clarity. Amazon’s strategic focus on AI, evidenced by its North Carolina investment and robotics initiatives, positions it to capitalize on long-term growth trends. Analysts project 2025 EPS of $6.31, a 14.1% increase, reinforcing AMZN’s appeal for long-term investors.
Conclusion
Amazon’s 6.75% stock gain over the past five trading days reflects its resilience amid market volatility and strategic advancements in AI and cloud computing. Key news, including U.S.-China trade talks and Amazon’s $10 billion investment, has fueled investor confidence. Compared to Microsoft, AMZN shows stronger short-term momentum, while inverse ETFs like PSQ offer hedging opportunities. Tickeron’s AI-driven tools, including its Trading Bots, provide investors with powerful resources to navigate AMZN’s market movements. As Amazon continues to innovate, its stock remains a compelling option for investors seeking exposure to technology and e-commerce, with Tickeron.com offering the tools to maximize returns.
AMZN’s MACD Histogram just turned positive
(Jun 06, 2025)
The Moving Average Convergence Divergence (MACD) for AMZN turned positive on June 06, 2025. Looking at past instances where AMZN’s MACD turned positive, the stock continued to rise in 41 of 52 cases over the following month. The odds of a continued upward trend are 79%.
Technical Analysis (Indicators)
Bullish Trend Analysis
The Momentum Indicator moved above the 0 level on June 04, 2025. You may want to consider a long position or call options on AMZN as a result. In 62 of 79 past instances where the momentum indicator moved above 0, the stock continued to climb. The odds of a continued upward trend are 78%.
AMZN moved above its 50-day moving average on May 08, 2025 date and that indicates a change from a downward trend to an upward trend.
The 10-day moving average for AMZN crossed bullishly above the 50-day moving average on May 12, 2025. This indicates that the trend has shifted higher and could be considered a buy signal. In 6 of 17 past instances when the 10-day crossed above the 50-day, the stock continued to move higher over the following month. The odds of a continued upward trend are 35%.
Following a +3.06% 3-day Advance, the price is estimated to grow further. Considering data from situations where AMZN advanced for three days, in 228 of 324 cases, the price rose further within the following month. The odds of a continued upward trend are 70%.
The Aroon Indicator entered an Uptrend today. In 218 of 286 cases where AMZN Aroon’s Indicator entered an Uptrend, the price rose further within the following month. The odds of a continued Uptrend are 76%.
Bearish Trend Analysis
The RSI Oscillator demonstrated that the stock has entered the overbought zone. This may point to a price pull-back soon.
The Stochastic Oscillator demonstrated that the ticker has stayed in the overbought zone for 4 days. The longer the ticker stays in the overbought zone, the sooner a price pull-back is expected.
Following a 3-day decline, the stock is projected to fall further. Considering past instances where AMZN declined for three days, the price rose further in 50 of 62 cases within the following month. The odds of a continued downward trend are 58%.
AMZN broke above its upper Bollinger Band on June 06, 2025. This could be a sign that the stock is set to drop as the stock moves back below the upper band and toward the middle band. You may want to consider selling the stock or exploring put options.
Fundamental Analysis (Ratings)
The Tickeron Seasonality Score of 1 (best 1–100 worst) indicates that the company is seriously undervalued in the industry. The Tickeron Seasonality score describes the variance of predictable price changes around the same period every calendar year. These changes can be tied to a specific month, quarter, holiday or vacation period, as well as a meteorological or growing season.
The Tickeron SMR rating for this company is 39 (best 1–100 worst), indicating strong sales and a profitable business model. SMR (Sales, Margin, Return on Equity) rating is based on comparative analysis of weighted Sales, Income Margin and Return on Equity values compared against S&P 500 index constituents. The weighted SMR value is a proprietary formula developed by Tickeron and represents an overall profitability measure for a stock.
The Tickeron Profit vs. Risk Rating rating for this company is 44 (best 1–100 worst), indicating well-balanced risk and returns. The average Profit vs. Risk Rating for the industry is 90, placing this stock slightly better than average.
The Tickeron Price Growth Rating for this company is 46 (best 1–100 worst), indicating steady price growth. AMZN’s price grows at a higher rate over the last 12 months as compared to S&P 500 index constituents.
The Tickeron PE Growth Rating for this company is 87 (best 1–100 worst), pointing to worse than average earnings growth. The PE Growth rating is based on a comparative analysis of stock PE ratio increase over the last 12 months compared against S&P 500 index constituents.
The Tickeron Valuation Rating of 90 (best 1–100 worst) indicates that the company is significantly overvalued in the industry. This rating compares the market capitalization estimated by our proprietary formula with the current market capitalization. This rating is based on the following metrics, as compared to industry averages: P/B Ratio (7.530) is normal, around the industry mean (4.554). P/E Ratio (35.339) is within average values for comparable stocks (49.802). AMZN’s Projected Growth (PEG Ratio) (2.401) is slightly higher than the industry average of (1.415). Dividend Yield (0.000) settles around the average of (0.075) among similar stocks. P/S Ratio (3.587) is also within normal values, averaging (6.503).
AMZN is expected to report earnings to fall 16.98% to $1.32 per share on July 31
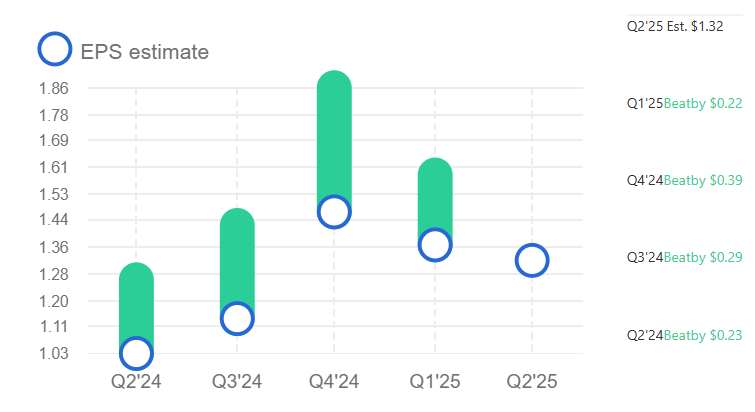
The last earnings report on May 01 showed earnings per share of $1.59, beating the estimate of $1.37. With 37.58M shares outstanding, the current market capitalization sits at 2.27T.
Notable companies
The most notable companies in this group are Amazon.com (NASDAQ:AMZN), Alibaba Group Holding Limited (NYSE:BABA), PDD Holdings (NASDAQ:PDD), JD.com (NASDAQ:JD), eBay (NASDAQ:EBAY), Chewy (NYSE:CHWY), Vipshop Holdings Limited (NYSE:VIPS), Wayfair (NYSE:W), Just Eat Takeaway.com N.V. (OTC:JTKWY), Revolve Group (NYSE:RVLV).
Industry description
The internet retail industry includes companies that sell products and services through the Internet. With more and more consumers using online retailers, the companies have seen a big increase in the use of their services. Some of the companies in the group are focused on selling business-to-business products and services. Others sell business-to-consumer products and services. Internet retailers offer a wide variety of products like books, apparel, and electronics. Some companies even specialize in only one or two categories. One potentially critical factor for players to thrive in this space is the quality and speed of product delivery. This requires an investment in efficient distribution networks. Things like logistics are important factors in the success of the extremely competitive industry. For a company to stay relevant in the industry, it must have effective pricing strategies and upgraded websites. The websites must be easy to navigate and engaging for customers. In addition to the revenues generated from straight sales, internet retailers can generate revenue from subscription fees and advertising. Amazon.com, Inc., Alibaba Group, and JD.com are some of the global leaders.
Market Cap
The average market capitalization across the Internet Retail Industry is 44.79 B. The market cap for tickers in the group ranges from 622 to 2.27T. AMZN holds the highest valuation in this group at 2.27T. The lowest valued company is RBZHF at 622.
High and low price notable news
The average weekly price growth across all stocks in the Internet Retail Industry was 8%. For the same Industry, the average monthly price growth was 7%, and the average quarterly price growth was 45%. NEGG experienced the highest price growth at 156%, while PIKM experienced the biggest fall at -53%.
AMZN in upward trend: price rose above 50-day moving average on November 25, 2025
AMZN moved above its 50-day moving average on November 25, 2025 date and that indicates a change from a downward trend to an upward trend. In of 38 similar past instances, the stock price increased further within the following month. The odds of a continued upward trend are .

Technical Analysis (Indicators)
Bullish Trend Analysis
The Stochastic Oscillator suggests the stock price trend may be in a reversal from a downward trend to an upward trend. of 58 cases where AMZN's Stochastic Oscillator exited the oversold zone resulted in an increase in price. Tickeron's analysis proposes that the odds of a continued upward trend are .
Following a 3-day Advance, the price is estimated to grow further. Considering data from situations where AMZN advanced for three days, in of 320 cases, the price rose further within the following month. The odds of a continued upward trend are .
Bearish Trend Analysis
The 10-day RSI Indicator for AMZN moved out of overbought territory on November 06, 2025. This could be a bearish sign for the stock. Traders may want to consider selling the stock or buying put options. Tickeron's A.I.dvisor looked at 45 similar instances where the indicator moved out of overbought territory. In of the 45 cases, the stock moved lower in the following days. This puts the odds of a move lower at .
The Momentum Indicator moved below the 0 level on November 14, 2025. You may want to consider selling the stock, shorting the stock, or exploring put options on AMZN as a result. In of 78 cases where the Momentum Indicator fell below 0, the stock fell further within the subsequent month. The odds of a continued downward trend are .
The Moving Average Convergence Divergence Histogram (MACD) for AMZN turned negative on November 14, 2025. This could be a sign that the stock is set to turn lower in the coming weeks. Traders may want to sell the stock or buy put options. Tickeron's A.I.dvisor looked at 56 similar instances when the indicator turned negative. In of the 56 cases the stock turned lower in the days that followed. This puts the odds of success at .
The 10-day moving average for AMZN crossed bearishly below the 50-day moving average on November 26, 2025. This indicates that the trend has shifted lower and could be considered a sell signal. In of 16 past instances when the 10-day crossed below the 50-day, the stock continued to move higher over the following month. The odds of a continued downward trend are .
Following a 3-day decline, the stock is projected to fall further. Considering past instances where AMZN declined for three days, the price rose further in of 62 cases within the following month. The odds of a continued downward trend are .
AMZN broke above its upper Bollinger Band on October 31, 2025. This could be a sign that the stock is set to drop as the stock moves back below the upper band and toward the middle band. You may want to consider selling the stock or exploring put options.
The Aroon Indicator for AMZN entered a downward trend on October 27, 2025. This could indicate a strong downward move is ahead for the stock. Traders may want to consider selling the stock or buying put options.
The Tickeron SMR rating for this company is (best 1 - 100 worst), indicating strong sales and a profitable business model. SMR (Sales, Margin, Return on Equity) rating is based on comparative analysis of weighted Sales, Income Margin and Return on Equity values compared against S&P 500 index constituents. The weighted SMR value is a proprietary formula developed by Tickeron and represents an overall profitability measure for a stock.
The Tickeron Price Growth Rating for this company is (best 1 - 100 worst), indicating steady price growth. AMZN’s price grows at a higher rate over the last 12 months as compared to S&P 500 index constituents.
The Tickeron Profit vs. Risk Rating rating for this company is (best 1 - 100 worst), indicating well-balanced risk and returns. The average Profit vs. Risk Rating rating for the industry is 92, placing this stock slightly better than average.
The Tickeron PE Growth Rating for this company is (best 1 - 100 worst), pointing to worse than average earnings growth. The PE Growth rating is based on a comparative analysis of stock PE ratio increase over the last 12 months compared against S&P 500 index constituents.
The Tickeron Valuation Rating of (best 1 - 100 worst) indicates that the company is slightly overvalued in the industry. This rating compares market capitalization estimated by our proprietary formula with the current market capitalization. This rating is based on the following metrics, as compared to industry averages: P/B Ratio (6.627) is normal, around the industry mean (6.246). P/E Ratio (32.367) is within average values for comparable stocks, (60.078). Projected Growth (PEG Ratio) (1.806) is also within normal values, averaging (2.501). Dividend Yield (0.000) settles around the average of (0.084) among similar stocks. P/S Ratio (3.582) is also within normal values, averaging (16.981).
Notable companies
Industry description
Market Cap
High and low price notable news
Volume
Fundamental Analysis Ratings
The average fundamental analysis ratings, where 1 is best and 100 is worst, are as follows

Advertisement
General Information
a provider of on-line retail shopping services
Industry InternetRetail
Advertisement