


Sezzle (SEZL) Stock Increase: The Structure of a 620% Increase
Comprehensive Analysis of SEZL's Remarkable Q2 2025 Performance
Sezzle Inc. (SEZL) has delivered one of the most extraordinary stock performances of 2025, surging an astounding 620% from its April 4 low of $24.86 to $179.25 as of July 1, 2025. This remarkable ascent represents one of the most dramatic success stories in the Buy Now, Pay Later (BNPL) sector and warrants comprehensive examination of the fundamental catalysts driving this exceptional growth.
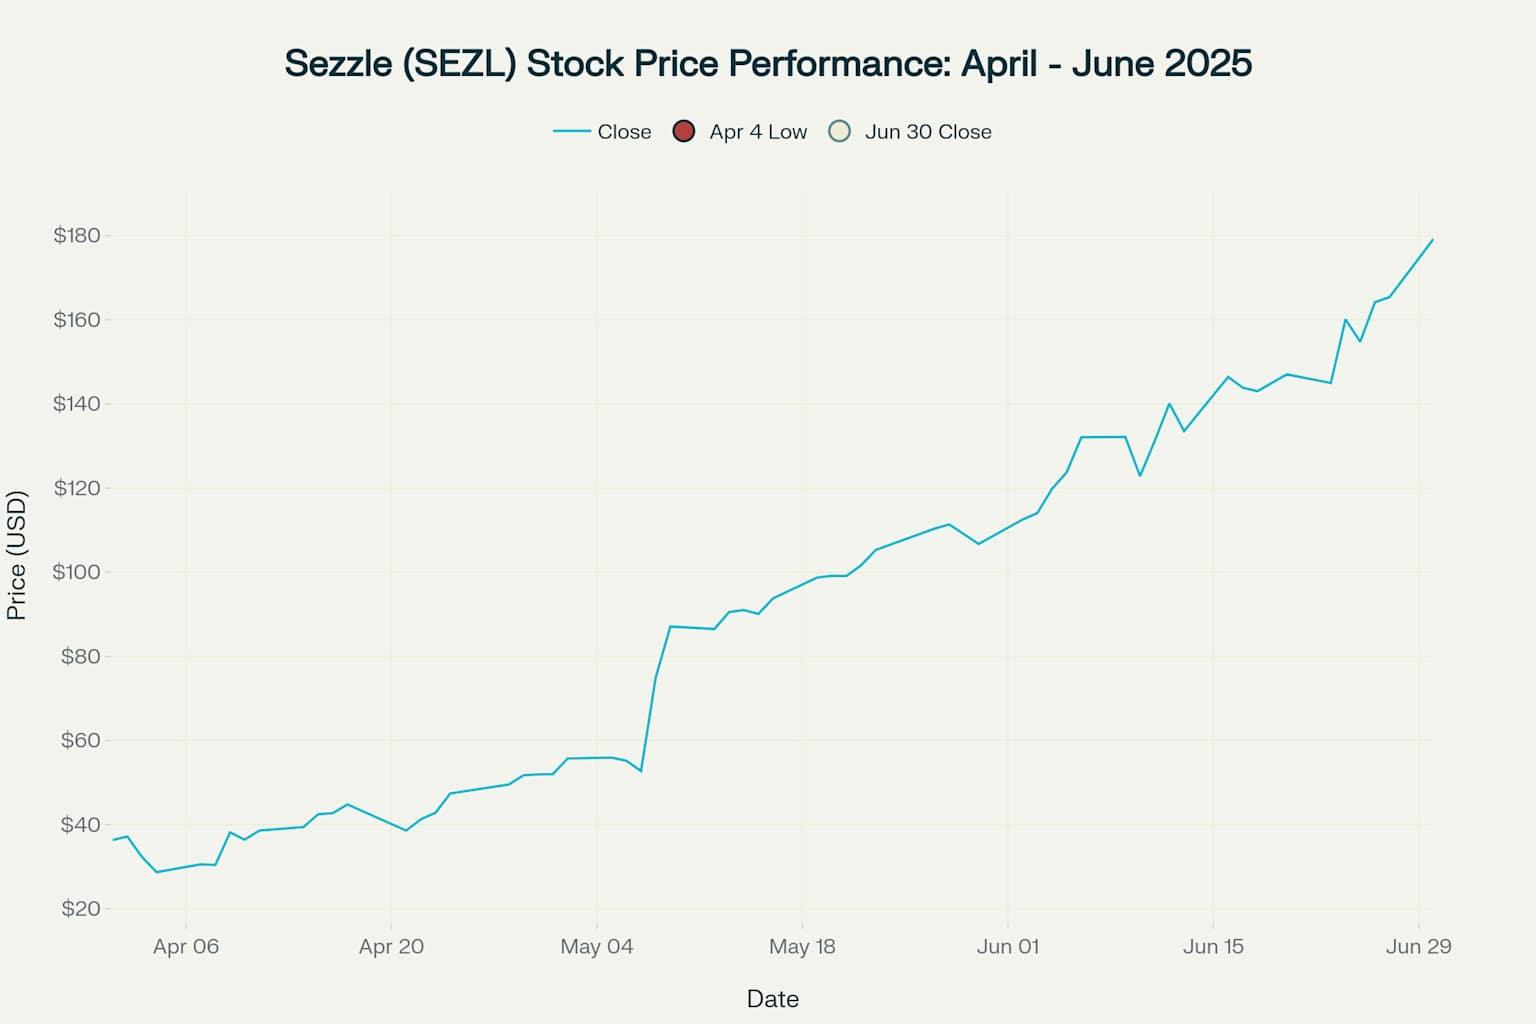
Sezzle stock price chart showing the remarkable 621% gain from April 4 low to June 30, 2025
Company Overview: Pioneering the BNPL Revolution
What Sezzle Does
Sezzle operates as a purpose-driven digital payment platform that specializes in Buy Now, Pay Later (BNPL) solutions. Founded in 2016 by Charles Youakim and Paul Paradis, the Minneapolis-based company has built a comprehensive ecosystem that financially empowers the next generation through innovative payment solutions.
The company's core offering allows consumers to split purchases into four equal, interest-free installments over six weeks, with the first payment due at checkout and subsequent payments every two weeks. Unlike traditional credit products, Sezzle's platform is designed to be accessible to consumers with little-to-no credit history, addressing a significant gap in the financial services market.
Business Model Innovation
Sezzle operates on a multi-revenue stream model that includes:
- Transaction Income: Merchant processing fees (typically a percentage of transaction value plus fixed fee)
- Subscription Revenue: Premium services including Sezzle Premium and Sezzle Anywhere
- Consumer Fees: Late payment fees and service charges
- Partner Income: Interchange fees through virtual card solutions
The company has strategically positioned itself as a Certified B Corporation and Delaware Public Benefit Corporation, emphasizing its commitment to stakeholder capitalism and sustainable business practices.
The Perfect Storm: Catalysts Behind the 620% Surge
1. Explosive Q1 2025 Financial Performance
The primary catalyst for Sezzle's stock surge was its exceptional Q1 2025 earnings report released on May 7, 2025, which sent shares up 31.33% in after-hours trading.
The company's net income margin expanded to 34.5% from 17.0% in the prior year, demonstrating remarkable operational leverage and efficiency improvements.
2. Strategic WebBank Partnership
In August 2024, Sezzle announced a five-year strategic partnership with WebBank, an FDIC-insured Utah-chartered industrial bank. This partnership became operational in Q4 2024 and significantly contributed to Q1 2025's outstanding performance.
Partnership Benefits:
- WebBank serves as exclusive originator for Sezzle's Pay-in-2 and Pay-in-4 products
- Enhanced revenue recognition through improved monetization
- Reduced operational risk through bank partnership
- Expanded product capabilities and regulatory compliance
This partnership enabled the launch of Sezzle On-Demand, a non-subscription product that allows consumers to generate single-use virtual cards for purchases anywhere Visa is accepted.
3. Product Innovation and Expansion
Sezzle's product development strategy has been a key differentiator, with multiple new features launched in 2025:
New Product Features:
- Pay-in-5 (Beta): Extended payment terms for larger purchases
- Sezzle Balance: Pre-loadable digital wallet with over $65 million in consumer deposits
- Auto-Couponing: Automated deal discovery and application
- Price Comparison Tools: AI-driven price tracking and notifications
- Express Checkout: Streamlined checkout experience for returning customers
These innovations have driven consumer purchase frequency to 6.1 times per quarter, up from 4.5 times in Q1 2024.
4. Subscription Business Growth
Sezzle's subscription products have become a critical growth engine, representing approximately 30% of total revenue:
- Sezzle Premium: Access to select large merchants with additional benefits
- Sezzle Anywhere: Virtual card usage anywhere Visa is accepted
Subscription revenue grew 59.7% year-over-year to $23.4 million in Q1 2025, with active subscribers reaching 658,000 monthly users.
5. Strategic Brand Partnerships
The company secured significant brand partnerships that enhanced its market visibility:
Minnesota Timberwolves Sponsorship: A multi-year jersey patch partnership that significantly increased brand awareness, with the deal reportedly worth $10 million annually.
New Merchant Partnerships: Expansion with Scheels (premium sporting goods) and WHOP (creator marketplaces), diversifying revenue streams and accessing high-value customer segments.
6. Operational Excellence
Sezzle demonstrated remarkable operational efficiency improvements:
- Operating margin expanded to 47.6% from 29.4% year-over-year
- Total operating expenses as percentage of revenue decreased by 18.2 percentage points
- Cost of revenue optimization through WebBank partnership reduced transaction costs
Market Dynamics: The BNPL Boom
Industry Growth Trajectory
The BNPL market is experiencing explosive growth, with multiple research firms projecting significant expansion:
- Global BNPL market expected to reach $560.1 billion in 2025, growing 13.7% annually
- U.S. market projected at $122.26 billion in 2025, with 12.2% annual growth
- Long-term projections suggest the market could reach $911.8 billion by 2030
This macro trend has created a favorable environment for well-positioned players like Sezzle to capture market share and drive growth.
Competitive Positioning
Sezzle competes in a dynamic landscape dominated by several key players:
Major Competitors:
- Affirm: Market leader with extensive merchant partnerships
- Klarna: European-based with strong global presence
- Afterpay (Block): Integrated with Square ecosystem
- PayPal Pay in 4: Leveraging PayPal's merchant network
- Apple Pay Later: Tech giant entering the space
Sezzle differentiates itself through its consumer-friendly approach, offering features like free payment rescheduling and account reactivation fee waivers.
Corporate Actions and Shareholder Value Creation
Stock Split and Share Buyback Program
In March 2025, Sezzle announced two significant corporate actions designed to enhance shareholder value:
- 6-for-1 Stock Split: Executed on March 28, 2025, to make shares more accessible to retail investors
- $50 Million Share Buyback Program: Demonstrating management's confidence in the company's value proposition
These actions improved stock liquidity and signaled strong capital allocation discipline.
Upgraded Financial Guidance
Following Q1 2025 results, Sezzle raised its full-year guidance significantly:
- 2025 Net Income: Increased by nearly 50% to $120 million
- Revenue Growth: Projected at 60-65% for full year 2025
- Pre-tax Income Growth: Expected to exceed 55%
This guidance upgrade provided additional confidence in the company's growth trajectory.
Strategic Legal Action: The Shopify Antitrust Lawsuit
On June 9, 2025, Sezzle filed an antitrust lawsuit against Shopify Inc. in U.S. District Court, alleging monopolistic practices in the BNPL space. Key aspects include:
- Allegations: Shopify engaging in anticompetitive conduct to limit BNPL competition
- Financial Impact: Shopify-related revenue represented less than 5% of Q1 2025 total revenue
- Strategic Position: Sezzle reaffirmed its fiscal 2025 guidance, indicating minimal expected impact
This legal action demonstrates Sezzle's commitment to maintaining competitive market dynamics and protecting consumer choice.
Financial Health and Operational Metrics
Balance Sheet Strength
Sezzle has maintained robust financial health throughout its growth phase:
- Cash Position: $88.89 million as of latest reporting
- Current Ratio: 2.62, indicating strong liquidity
- Debt-to-Equity Ratio: 0.56, demonstrating conservative leverage
Key Performance Indicators
The company's operational metrics demonstrate healthy business fundamentals:
Metric
Current Performance
Growth Trajectory
Active Consumers
2.73 million
Stable base with improved engagement
Monthly Subscribers
658,000
Strong subscription adoption
Consumer Purchase Frequency
6.1x quarterly
Up from 4.5x year-over-year
Revenue per GMV Dollar
13.0%
Improved from 9.5% prior year
Credit Performance
Sezzle has maintained disciplined credit management despite rapid growth:
- Provision for Credit Losses: 12.6% of revenue in Q1 2025, compared to 10.9% in Q1 2024
- Consumer Payment Performance: Better-than-expected repayment trends contributing to profitability
Management and Corporate Governance
Leadership Team
Sezzle benefits from experienced leadership with significant skin in the game:
Charles Youakim (CEO and Co-Founder)
- Tenure: 9.4 years
- Ownership: 44.08% of company shares ($2.4 billion value)
- Compensation: $2.22 million annually (24% salary, 76% performance-based)
Paul Paradis (President and Co-Founder)
- Ownership: 3.9% of company shares ($214.8 million value)
- Background: Former Minnesota Timberwolves sales experience
Karen Hartje (Chief Financial Officer)
- Tenure: 7.2 years
- Ownership: 0.40% of company shares
Institutional Ownership
Sezzle has attracted significant institutional interest, with 294 institutional owners holding approximately 30% of outstanding shares:
Major Institutional Holders:
- Vanguard Group: $35.37 million position
- G2 Investment Partners: $26.14 million position
- Marshall Wace LLP: $20.46 million position
- BlackRock Inc.: Significant position
- Geode Capital Management: Notable holding
The institutional ownership increase of 575.83% in the most recent quarter demonstrates growing confidence from sophisticated investors.
Analyst Coverage and Market Sentiment
Wall Street Recognition
Sezzle has gained increased analyst attention following its strong performance:
- Consensus Rating: Buy from 3 analysts
- Price Targets: Average target of $301.67 for 2025
- Oppenheimer Coverage: Outperform rating with $168 price target
Industry Recognition
The company has received notable industry accolades:
- Forbes: Ranked 3rd among America's Most Successful Mid-Cap Companies
- B Corporation Certification: Maintained since 2021, emphasizing social responsibility
- Purpose-Driven Leadership: Recognition for stakeholder-focused approach
Future Outlook: Navigating Opportunities and Challenges
Growth Opportunities
1. Market Expansion
- Continued penetration in the growing BNPL market
- Geographic expansion potential beyond current North American focus
- Vertical market opportunities in healthcare, automotive, and other sectors
2. Product Innovation
- Enhanced AI-driven personalization features
- Expanded credit-building capabilities through Sezzle Up
- Integration of additional financial services
3. Strategic Partnerships
- Potential partnerships with major retailers and e-commerce platforms
- Fintech collaboration opportunities
- Banking partnership expansion beyond WebBank
Key Risk Factors
1. Regulatory Environment
The BNPL sector faces increasing regulatory scrutiny from the Consumer Financial Protection Bureau (CFPB) and other agencies. New regulations could impact operational flexibility and increase compliance costs.
2. Competitive Pressure
The BNPL market remains highly competitive, with well-funded competitors and potential new entrants from traditional financial institutions.
3. Economic Sensitivity
Consumer spending patterns and credit quality can be impacted by macroeconomic conditions, interest rates, and employment levels.
4. Technology and Security Risks
As a technology-driven platform, Sezzle faces ongoing cybersecurity threats and the need for continuous innovation.
Financial Projections and Valuation
Based on current trends and management guidance, Sezzle appears positioned for continued strong performance:
2025 Outlook:
- Revenue Growth: 60-65% as guided by management
- Net Income: $120 million target (nearly 50% increase from guidance)
- Market Share Gains: Continued penetration in expanding BNPL market
Valuation Metrics:
- Current P/E Ratio: 60.35 based on trailing earnings
- Market Capitalization: $5.97 billion as of July 1, 2025
- Price-to-Sales: Attractive relative to growth rate and market position
Investment Thesis: The Case for Continued Growth
Bull Case Arguments
- Execution Excellence: Demonstrated ability to exceed financial targets and operational metrics
- Market Leadership: Strong positioning in rapidly growing BNPL sector
- Product Innovation: Continuous development of consumer-friendly features and services
- Strategic Partnerships: WebBank relationship and brand partnerships driving growth
- Financial Discipline: Profitable growth model with strong cash generation
- Management Quality: Experienced leadership team with significant ownership alignment
Bear Case Considerations
- Valuation Concerns: Stock price appreciation may have outpaced fundamental improvements
- Regulatory Risk: Potential for increased regulatory restrictions on BNPL operations
- Competitive Pressure: Well-funded competitors may challenge market share
- Economic Sensitivity: Potential impact from economic downturn on consumer spending
Tickeron: AI Tools for Navigating Fast-Moving Markets
As fintech companies like Sezzle demonstrate the explosive potential of digital finance, platforms such as Tickeron are empowering traders and investors to act on these market shifts with confidence. Tickeron leverages artificial intelligence to deliver real-time trading insights, predictive analytics, and automated decision-making tools across a wide range of assets.
Whether you're analyzing breakout candidates or seeking confirmation signals, Tickeron's ecosystem of AI agents adapts to diverse trading styles and strategies.
Key highlights include:
- AI Agents (60min / 15min / 5min): Machine learning–driven agents that generate intraday trade ideas with clear entry and exit points based on short-term price action.
- AI Pattern Search Engine that detects technical chart formations with breakout targets and confidence levels.
- Trend Prediction Engine delivering projected entry/exit prices within minutes of market open.
- Real-Time Signal Screener scanning thousands of tickers, ETFs, and cryptos with up-to-date buy/sell signals.
Tickeron's technology is designed to help traders keep pace with volatile markets—like the one Sezzle just surged through—by turning raw market data into actionable intelligence.
Conclusion: A Remarkable Transformation
Sezzle's 620% stock price surge from April to July 2025 represents far more than a speculative rally—it reflects the successful execution of a comprehensive business transformation strategy. The company has evolved from a simple BNPL provider to a comprehensive financial services platform that addresses the needs of digitally-native consumers.
Key Success Factors:
- Strategic Vision: Early recognition of BNPL market opportunity and execution against clear strategy
- Operational Excellence: Demonstration of scalable, profitable growth model
- Product Innovation: Continuous development of differentiated consumer experiences
- Partnership Strategy: Strategic relationships driving revenue and market expansion
- Financial Discipline: Profitable operations enabling reinvestment and shareholder returns
The convergence of strong fundamental performance, favorable market dynamics, strategic partnerships, and product innovation created the perfect environment for Sezzle's remarkable stock performance. While the rapid price appreciation raises questions about near-term valuation, the company's demonstrated execution capabilities and position in the growing BNPL market suggest continued potential for value creation.
For investors, Sezzle represents a compelling case study in how focused execution, strategic innovation, and market timing can drive exceptional shareholder returns. As the BNPL market continues to mature and expand globally, well-positioned players like Sezzle are likely to benefit from the ongoing transformation of consumer payment preferences and the digitization of financial services.
Contributor
Financial writer and active order flow futures trader with a focus on fundamental analysis, macroeconomic factors, and equity research. I make in-depth blogs on stocks and ETFs, bridging the gap between raw market data and real-world trading decisions.
SEZL in upward trend: price rose above 50-day moving average on October 09, 2026
SEZL moved above its 50-day moving average on October 09, 2026 date and that indicates a change from a downward trend to an upward trend. In 15 of 16 similar past instances, the stock price increased further within the following month. The odds of a continued upward trend are 90%.

Technical Analysis (Indicators)
Bullish Trend Analysis
The Momentum Indicator moved above the 0 level on October 06, 2026. You may want to consider a long position or call options on SEZL as a result. In 40 of 45 past instances where the momentum indicator moved above 0, the stock continued to climb. The odds of a continued upward trend are 89%.
The 10-day moving average for SEZL crossed bullishly above the 50-day moving average on October 15, 2026. This indicates that the trend has shifted higher and could be considered a buy signal. In 7 of 9 past instances when the 10-day crossed above the 50-day, the stock continued to move higher over the following month. The odds of a continued upward trend are 78%.
Following a +11.31% 3-day Advance, the price is estimated to grow further. Considering data from situations where SEZL advanced for three days, in 184 of 203 cases, the price rose further within the following month. The odds of a continued upward trend are 90%.
Bearish Trend Analysis
The 10-day RSI Indicator for SEZL moved out of overbought territory on October 14, 2026. This could be a bearish sign for the stock. Traders may want to consider selling the stock or buying put options. Tickeron's A.I.dvisor looked at 35 similar instances where the indicator moved out of overbought territory. In 29 of the 35 cases, the stock moved lower in the following days. This puts the odds of a move lower at 83%.
The Stochastic Oscillator demonstrated that the ticker has stayed in the overbought zone for 7 days. The longer the ticker stays in the overbought zone, the sooner a price pull-back is expected.
Following a 3-day decline, the stock is projected to fall further. Considering past instances where SEZL declined for three days, the price rose further in 50 of 62 cases within the following month. The odds of a continued downward trend are 85%.
SEZL broke above its upper Bollinger Band on October 08, 2026. This could be a sign that the stock is set to drop as the stock moves back below the upper band and toward the middle band. You may want to consider selling the stock or exploring put options.
The Aroon Indicator for SEZL entered a downward trend on October 05, 2026. This could indicate a strong downward move is ahead for the stock. Traders may want to consider selling the stock or buying put options.
Fundamental Analysis (Ratings)
The Tickeron SMR rating for this company is 15 (best 1 - 100 worst), indicating very strong sales and a profitable business model. SMR (Sales, Margin, Return on Equity) rating is based on comparative analysis of weighted Sales, Income Margin and Return on Equity values compared against S&P 500 index constituents. The weighted SMR value is a proprietary formula developed by Tickeron and represents an overall profitability measure for a stock.
The Tickeron Price Growth Rating for this company is 39 (best 1 - 100 worst), indicating steady price growth. SEZL’s price grows at a higher rate over the last 12 months as compared to S&P 500 index constituents.
The Tickeron PE Growth Rating for this company is 56 (best 1 - 100 worst), pointing to consistent earnings growth. The PE Growth rating is based on a comparative analysis of stock PE ratio increase over the last 12 months compared against S&P 500 index constituents.
The Tickeron Valuation Rating of 100 (best 1 - 100 worst) indicates that the company is significantly overvalued in the industry. This rating compares market capitalization estimated by our proprietary formula with the current market capitalization. This rating is based on the following metrics, as compared to industry averages: P/B Ratio (15.649) is normal, around the industry mean (3.945). P/E Ratio (23.750) is within average values for comparable stocks, (14.459). Projected Growth (PEG Ratio) (0.066) is also within normal values, averaging (3.918). Dividend Yield (0.000) settles around the average of (0.050) among similar stocks. P/S Ratio (7.800) is also within normal values, averaging (5.901).
The Tickeron Profit vs. Risk Rating rating for this company is 100 (best 1 - 100 worst), indicating that the returns do not compensate for the risks. SEZL’s unstable profits reported over time resulted in significant Drawdowns within these last five years. A stable profit reduces stock drawdown and volatility. The average Profit vs. Risk Rating rating for the industry is 78, placing this stock worse than average.
Notable companies
Industry description
Market Cap
High and low price notable news
Volume
Fundamental Analysis Ratings
The average fundamental analysis ratings, where 1 is best and 100 is worst, are as follows

Advertisement
General Information
Industry SavingsBanks
Advertisement