


The meteoric rise of Regencell Bioscience Holdings (RGC) in 2025, driven by speculation and trading powered by artificial intelligence
Regencell Bioscience Holdings (RGC) has emerged as one of the most electrifying stories in the stock market in 2025, captivating traders and investors with its staggering price movements. With a year-to-date (YTD) gain of approximately 14,899% as of June 2025, RGC has defied conventional market expectations, driven by speculative momentum, a strategic stock split, and promising clinical trial developments. This article delves into RGC’s extraordinary performance, key market news as of June 23, 2025, and how Tickeron’s AI-driven tools, available at Tickeron.com, are empowering traders to navigate its volatility. Additionally, it explores a highly correlated stock, the role of inverse ETFs as a hedging strategy, and the transformative impact of Tickeron’s AI Trading Agents.
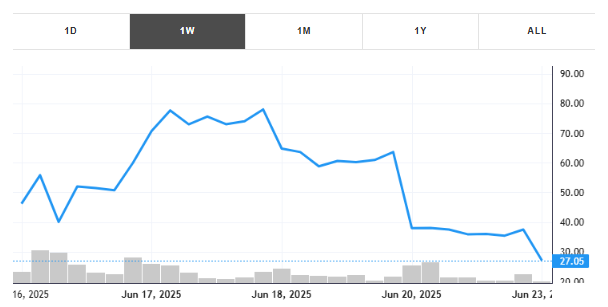
These past five trading days, the stock lost 41.53% with an average daily volume of 150555 shares traded. The stock tracked a drawdown of -67.68% for this period.
RGC’s Unprecedented 2025 Performance
Regencell Bioscience Holdings, a Hong Kong-based biopharmaceutical company focused on developing treatments for neurocognitive disorders such as ADHD and autism spectrum disorder (ASD), has experienced a historic rally in 2025. Starting the year at around $3.25 per share, RGC surged to a high of $950 in just a few months, marking a jaw-dropping 14,899% YTD increase as reported on June 6, 2025. In May 2025 alone, the stock gained 894.45%, with an average daily trading volume of 87,874 shares, reflecting intense market interest. However, posts on X highlight extreme intraday volatility, with one instance on June 16, 2025, showing a price spike to $82.57 before plunging to $18.72 — a 350% intraday swing.
ueled by a combination of factors: a 38-for-1 stock split, speculative enthusiasm amplified by social media, and positive results from RGC’s second efficacy trial for its ADHD therapy. Despite these drivers, the absence of clear fundamental catalysts for such a rapid rise has raised concerns. X posts suggest that much of the 45,800% YTD gain reported on June 16, 2025, stems from speculative “vibes” and algorithmic trading rather than sustainable revenue or earnings growth. Technical indicators, such as the Relative Strength Index (RSI) signaling overbought conditions and low liquidity, underscore the stock’s high-risk profile.
Market Movements and News on June 23, 2025
As of June 23, 2025, RGC remains a focal point in the market, with its price dynamics continuing to draw attention. On this date, X posts indicate that RGC was trading along a key support trendline at $372.83, showing relative strength but needing to hold this level to break above $400 potentially. The Moving Average Convergence Divergence (MACD) was under the signal line, suggesting caution for traders eyeing a breakout. Earlier in the week, on June 18, RGC hit an all-time high of $78, as reported by Tickeron, before experiencing a dramatic pullback.
Broader market trends on June 23, 2025, reflect a volatile environment. According to Tickeron.com, the SPDR S&P 500 ETF Trust (SPY) closed at approximately $599.53 on June 12, with a YTD gain of 1.38%, signaling resilience amid mixed economic signals. Meanwhile, tech giants like NVIDIA, Tesla, and Amazon surged over 40% in April 2025, driven by AI breakthroughs and strong earnings, creating a bullish backdrop for speculative stocks like RGC. However, a $2 trillion market sell-off earlier in 2025 has heightened volatility, with investors questioning whether the current market resembles the 2008 recession or the dot-com crash. This turbulence underscores the importance of AI-driven tools for navigating stocks like RGC.
Comparison with a Highly Correlated Stock: IXHL
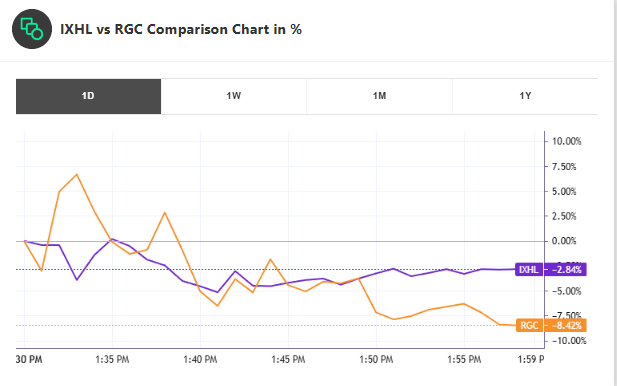
To contextualize RGC’s performance, a comparison with Incannex Healthcare (IXHL), a biotech stock with a high correlation to RGC, is insightful. Both companies operate in the biopharmaceutical sector, focusing on innovative treatments for neurological conditions. On June 18, 2025, IXHL was mentioned alongside RGC as part of a group of biotech stocks hitting all-time highs. Like RGC, IXHL has benefited from speculative interest in biotech breakthroughs, particularly in mental health therapies. However, IXHL’s market cap and trading volume are generally lower, and its price movements, while volatile, have not matched RGC’s extreme YTD gains. Tickeron’s AI tools, accessible at Tickeron.com, reveal that IXHL’s Momentum Indicator turned positive in early June 2025, suggesting potential for further upside but with less intensity than RGC’s parabolic surge. Traders can use Tickeron’s platform to compare real-time trends and analytics for both stocks, identifying correlated opportunities.
Trading RGC with Inverse ETFs for Risk Management
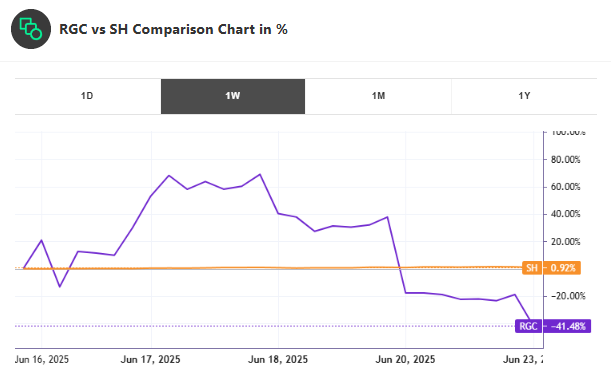
Given RGC’s extreme volatility, pairing it with an inverse ETF that is anti-correlated to its movements can be a strategic approach to manage risk. The ProShares Short S&P 500 (SH), which delivers daily inverse performance to the S&P 500, is an effective hedge against RGC’s potential pullbacks due to its negative correlation with speculative, high-beta stocks like RGC. For instance, if RGC’s RSI signals overbought conditions, as seen on June 16, 2025, traders could buy SH to capitalize on a potential market correction while maintaining a long position in RGC. This strategy, supported by Tickeron’s AI-driven insights at Tickeron.com, allows traders to balance upside potential with downside protection. However, inverse ETFs like SH carry risks due to daily rebalancing, making them suitable only for short-term strategies, and traders should monitor technical indicators closely to time their exits.
Tickeron’s AI Trading Agents: Revolutionizing RGC Trading
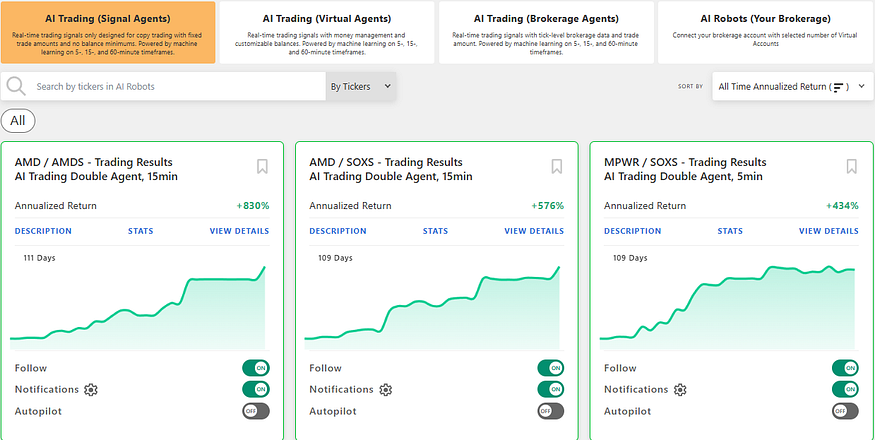
Tickeron’s AI Trading Agents, powered by Financial Learning Models (FLMs), have become indispensable for traders navigating volatile stocks like RGC. Under the leadership of CEO Sergey Savastiouk, Tickeron has developed user-friendly bots and Double Agents that combine real-time data analysis with machine learning to deliver precise buy and sell signals. For RGC, these tools, available at Tickeron.com, leverage technical indicators like RSI, MACD, and Bollinger Bands to identify key entry and exit points. On June 16, 2025, Tickeron’s AI Buy/Sell Alert System for RGC enabled traders to set target prices and receive customized action alerts, enhancing decision-making in a high-risk environment. The Double Agent strategy, which pairs bullish and bearish trades, has proven particularly effective, achieving annualized returns of up to 362% for other volatile assets like SOXL. By integrating these tools, traders can approach RGC’s erratic price swings more confidently and precisely.
Risks and Outlook for RGC
Despite its meteoric rise, RGC’s rally carries significant risks. The stock’s overbought conditions, low liquidity, and lack of consistent revenue raise concerns about sustainability. A three-day decline reported on May 23, 2025, suggested potential further downside, with Tickeron’s analysis indicating that in 62 similar cases, RGC continued to fall in the following month. Clinical trial risks and regulatory challenges in the biotech sector further complicate the outlook, as noted in X posts highlighting competition from larger biotechs. Nevertheless, RGC’s focus on high-demand areas like neurodegenerative disease treatments offers long-term potential, provided it can deliver on its clinical promises.
Conclusion
Regencell Bioscience Holdings has redefined market dynamics in 2025, with its 14,899% YTD surge capturing the imagination of traders worldwide. While speculative momentum and clinical trial buzz have driven its ascent, the stock’s volatility demands sophisticated tools like those offered by Tickeron.com. By leveraging AI Trading Agents, comparing RGC with correlated stocks like IXHL, and hedging with inverse ETFs like SH, traders can navigate this high-risk, high-reward opportunity. As market volatility persists in June 2025, Tickeron’s FLM-powered solutions provide a critical edge for those aiming to capitalize on RGC’s extraordinary trajectory while managing its inherent risks.
RGC in upward trend: price may ascend as a result of having broken its lower Bollinger Band on November 24, 2025
RGC may jump back above the lower band and head toward the middle band. Traders may consider buying the stock or exploring call options. In of 39 cases where RGC's price broke its lower Bollinger Band, its price rose further in the following month. The odds of a continued upward trend are .

Technical Analysis (Indicators)
Bullish Trend Analysis
The RSI Indicator demonstrates that the ticker has stayed in the oversold zone for 2 days, which means it's wise to expect a price bounce in the near future.
The Stochastic Oscillator shows that the ticker has stayed in the oversold zone for 9 days. The price of this ticker is presumed to bounce back soon, since the longer the ticker stays in the oversold zone, the more promptly an upward trend is expected.
Following a 3-day Advance, the price is estimated to grow further. Considering data from situations where RGC advanced for three days, in of 135 cases, the price rose further within the following month. The odds of a continued upward trend are .
Bearish Trend Analysis
The Momentum Indicator moved below the 0 level on October 29, 2025. You may want to consider selling the stock, shorting the stock, or exploring put options on RGC as a result. In of 82 cases where the Momentum Indicator fell below 0, the stock fell further within the subsequent month. The odds of a continued downward trend are .
RGC moved below its 50-day moving average on November 03, 2025 date and that indicates a change from an upward trend to a downward trend.
The 10-day moving average for RGC crossed bearishly below the 50-day moving average on November 05, 2025. This indicates that the trend has shifted lower and could be considered a sell signal. In of 14 past instances when the 10-day crossed below the 50-day, the stock continued to move higher over the following month. The odds of a continued downward trend are .
Following a 3-day decline, the stock is projected to fall further. Considering past instances where RGC declined for three days, the price rose further in of 62 cases within the following month. The odds of a continued downward trend are .
The Aroon Indicator for RGC entered a downward trend on November 26, 2025. This could indicate a strong downward move is ahead for the stock. Traders may want to consider selling the stock or buying put options.
The Tickeron Price Growth Rating for this company is (best 1 - 100 worst), indicating steady price growth. RGC’s price grows at a higher rate over the last 12 months as compared to S&P 500 index constituents.
The Tickeron Seasonality Score of (best 1 - 100 worst) indicates that the company is fair valued in the industry. The Tickeron Seasonality score describes the variance of predictable price changes around the same period every calendar year. These changes can be tied to a specific month, quarter, holiday or vacation period, as well as a meteorological or growing season.
The Tickeron Valuation Rating of (best 1 - 100 worst) indicates that the company is significantly overvalued in the industry. This rating compares market capitalization estimated by our proprietary formula with the current market capitalization. This rating is based on the following metrics, as compared to industry averages: RGC's P/B Ratio (1111.111) is very high in comparison to the industry average of (16.589). P/E Ratio (0.000) is within average values for comparable stocks, (73.316). RGC's Projected Growth (PEG Ratio) (0.000) is slightly lower than the industry average of (1.951). RGC has a moderately low Dividend Yield (0.000) as compared to the industry average of (0.030). P/S Ratio (0.000) is also within normal values, averaging (55.567).
The Tickeron PE Growth Rating for this company is (best 1 - 100 worst), pointing to worse than average earnings growth. The PE Growth rating is based on a comparative analysis of stock PE ratio increase over the last 12 months compared against S&P 500 index constituents.
The Tickeron SMR rating for this company is (best 1 - 100 worst), indicating weak sales and an unprofitable business model. SMR (Sales, Margin, Return on Equity) rating is based on comparative analysis of weighted Sales, Income Margin and Return on Equity values compared against S&P 500 index constituents. The weighted SMR value is a proprietary formula developed by Tickeron and represents an overall profitability measure for a stock.
The Tickeron Profit vs. Risk Rating rating for this company is (best 1 - 100 worst), indicating that the returns do not compensate for the risks. RGC’s unstable profits reported over time resulted in significant Drawdowns within these last five years. A stable profit reduces stock drawdown and volatility. The average Profit vs. Risk Rating rating for the industry is 89, placing this stock worse than average.
Notable companies
Industry description
Market Cap
High and low price notable news
Volume
Fundamental Analysis Ratings
The average fundamental analysis ratings, where 1 is best and 100 is worst, are as follows

Advertisement
General Information
Industry PharmaceuticalsGeneric
Advertisement