In the realm of real-time pattern trading, the odds of success are quantified by Artificial Intelligence (A.I.) as the likelihood that a trading strategy successful in past conditions will continue to perform well. This is determined by analyzing historical patterns and outcomes from a wide range of stocks and ETFs, providing a statistical foundation for future performance predictions. Additionally, channel patterns are a core method for traders to pinpoint entry and exit points in stock trading. Although traditional channel trading rules offer a robust framework for understanding price movements within the channel, they fall short of predicting breakouts. By incorporating specific patterns, particularly Wolfe Waves and Gartleys, traders can attain predictive insights into the timing and scale of breakouts compared to the established channel, thereby enhancing trading strategies through a detailed focus on channeling techniques that leverage these patterns.
Instant Search of Intraday Patterns
In the rapidly evolving world of stock and ETF trading, leveraging Artificial Intelligence (AI) presents an unparalleled advantage in identifying optimal entry and exit points. This advantage stems from the AI's ability to scan thousands of assets within minutes—a task unfeasible for human traders. Such efficiency in pattern recognition extends to a wide array of time frames, ranging from as short as 5 minutes to as long as one day, accommodating diverse trading strategies from Day Trading (5 minutes to 30 minutes) to Swing Trading (1 hour and beyond). Each candle in this analysis can represent different time frames, varying from 5 minutes to 4 hours, and extending to 1 day, showcasing the AI's versatility in catering to various trading needs.
Pattern Odds of Success powered by AI Backtesting
The foundation of this AI-driven approach lies in its meticulous backtesting process, which scrutinizes the historical performance of identified patterns. By examining past outcomes, the AI calculates the success rate of these patterns, thereby forecasting the likelihood of future success. This methodical analysis is crucial for traders, as it equips them with statistically backed insights into the potential impact of their trades. It's worth noting that the simulated results, encompassing win/loss ratios, are derived from the retrospective application of a model designed with hindsight. Consequently, while past hypothetical backtest results offer valuable insights, they do not guarantee future returns, underscoring the dynamic nature of trading strategies and the importance of adaptive models.
Channel Up Pattern (may achieve 69-74% odds of success)
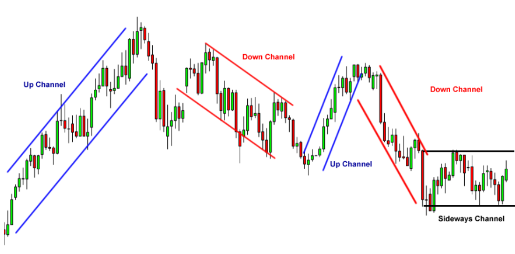
A Channel Up pattern is indicative of a distinct uptrend, characterized by the price moving between upward sloping parallel lines, marked by successive higher highs and lows. This pattern emerges through the connection of swing lows (points 1, 3, 5) with a lower trendline and swing highs (points 2, 4, 6) with an upper channel line. A breakout above the Channel Up’s resistance suggests a momentum continuation, while a breakdown below its support signifies a potential trend reversal. Traders often adopt a strategy of buying at the support line and selling at the resistance, with additional buy signals generated upon a resistance breakout. Conversely, a support line breakdown warrants consideration for short selling, pending confirmation from additional indicators.

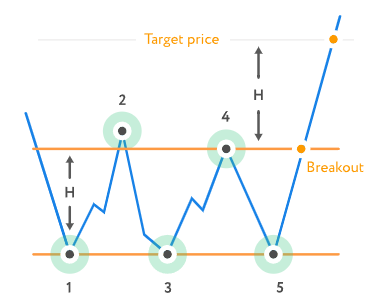
Rectangle Bottom Pattern (may achieve 76-84% odds of success)
The Rectangle Bottom pattern, characterized by its price moving within a bounded range defined by two horizontal lines, signals a market without a clear direction. This pattern typically emerges in markets experiencing a pronounced downtrend prior to formation. The trading strategy for a Rectangle Bottom involves initiating long positions following a breakout above the top boundary. The target price is determined by adding the height of the pattern to the breakout level. To mitigate risk, traders are advised to place stop orders below the breakout price.
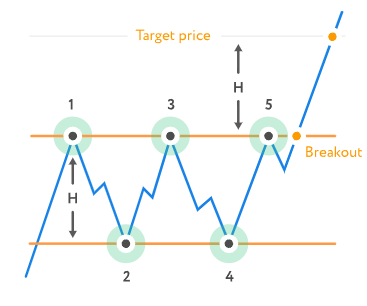
Rectangle Top Pattern (may achieve 73-88% odds of success)
Similar to the Rectangle Bottom, the Rectangle Top pattern also represents a range-bound market. However, it usually forms following a strong uptrend. The trading approach mirrors that of the Rectangle Bottom, with trades initiated upon a breakout above the upper boundary. The target price calculation and risk mitigation strategies remain consistent, emphasizing the importance of stop orders to limit potential losses.
Channel Down Pattern (may achieve 73-79% odds of success)
The Channel Down pattern, showcasing a clear downtrend, consists of price movement confined between downward-sloping parallel lines. This pattern is delineated by connecting swing lows with a lower trendline and swing highs with an upper channel line. A breakdown below the channel’s resistance line suggests a continuation of the downward momentum, while a breakout above it may indicate a trend reversal. Trading within a descending channel involves short selling at resistance and considering long positions near the support trendline, especially when a reversal pattern is identified.
The Classical Technical Analysis Perspective
The Rectangle pattern, as a classical technical analysis tool, emphasizes trading based on horizontal support and resistance levels. This approach, rooted in the pioneering work of Richard Schabaker and further developed by Edwards and Magee, relies on the assumption that price patterns are repetitive, allowing for predictive pattern recognition. Unlike modern technical analysis, which leans heavily on indicators, classical analysis focuses on geometrical shapes and pattern recognition for trading decisions. The Rectangle, alongside other geometric patterns like triangles and pennants, underscores the enduring relevance of classical technical analysis in today's trading environments.
Enhancing this innovative landscape, Sergey Savastiouk, Ph.D., CEO and Founder of Tickeron, underscores the significance of integrating extensive user feedback into the development of their Intraday Patterns. This tool, optimized for the swift identification of both bearish and bullish patterns, transforms a process that traditionally took weeks into one that takes mere seconds, thanks to AI advancements. This breakthrough is a testament to Tickeron's dedication to providing dependable and actionable trading signals, backed by comprehensive algorithm development expertise and cutting-edge AI technology. Catering specifically to the nuanced demands of cryptocurrency traders, Tickeron's AI-powered robots utilize classic price patterns such as "Channel Patterns" across various time intervals, ensuring enhanced trading performance and consistency.
Conclusion
Understanding and applying channel patterns, including the nuanced strategies associated with Rectangle Bottoms and Tops as well as Channel Up and Down formations, can significantly enhance a trader’s ability to navigate market dynamics. Incorporating insights from classical technical analysis further enriches this approach, providing a comprehensive framework for informed trading decisions.
The intricate exploration of channel patterns and their various formations offers a robust framework for traders aiming to optimize their market strategies. By delving into the specifics of Channel Up and Down patterns, along with the Rectangle Bottom and Top formations, this discussion illuminates the strategic avenues available for identifying entry and exit points, predicting breakouts, and managing risk. The inclusion of classical technical analysis perspectives, particularly the emphasis on geometric patterns and the historical insights of pioneers like Schabaker, Edwards, and Magee, enriches the modern trader's toolkit. These methodologies, grounded in the recognition of repetitive price patterns and the strategic application of support and resistance levels, stand as a testament to the enduring value of classical techniques in contemporary trading environments. As traders navigate the complexities of the financial markets, the insights and strategies outlined in this examination of channel patterns serve as a valuable guide, offering a pathway to more informed and potentially successful trading decisions.