In financial trading, the adoption of artificial intelligence (AI) has revolutionarily enhanced strategies and methodologies, especially evident in real-time pattern trading. Here, AI is pivotal in rapidly scanning thousands of stocks and ETFs, identifying viable trading opportunities within minutes—something human traders could hardly achieve. It excels at detecting intraday patterns and assessing their historical performance. The term "odds of success" specifically refers to the probability, determined by AI, that a trading strategy which has shown efficacy in past market conditions will continue to succeed. This likelihood is derived from a thorough analysis of historical data across various stocks and ETFs, providing a statistical foundation for forecasting future outcomes
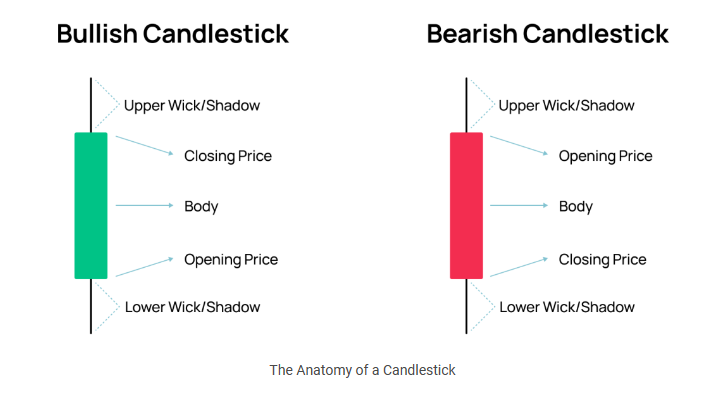
An intriguing aspect of intraday pattern trading is the flexibility in time frames, ranging from as short as 5 minutes to as long as one day. This flexibility allows traders to engage in day trading when focusing on patterns within the 5-minute to 30-minute range, and swing trading for patterns that unfold over 1 hour or more. It's noteworthy that within a single candle, different time frames can be represented, extending from 5 minutes up to 4 hours and even 1 day.
Instant Search of Intraday Patterns
Intraday Patterns are at the forefront of this AI-driven trading revolution. Every minute, AI scans the market landscape, identifying patterns across a broad spectrum of time frames. Once these patterns are
Intraday Patterns are at the forefront of this AI-driven trading revolution. Every minute, AI scans the market landscape, identifying patterns across a broad spectrum of time frames. Once these patterns are recognized, the AI system forecasts breakout prices, target prices, and levels of confidence, among other statistics. This process simplifies trading by allowing traders to specify their desired patterns and minimum confidence levels, after which AI takes over the task of locating these patterns, calculating potential trade impacts, and delivering the insights directly to the traders.
Pattern Odds of Success powered by AI Backtesting
The reliability of these intraday patterns is bolstered by rigorous backtesting, which applies a retroactive analysis to gauge how these patterns would have performed historically. This simulated analysis, offering insights into percentage of wins/losses and other vital statistics, is critical. It enables AI to refine its pattern recognition and prediction capabilities continually. However, it's important to note that past backtested results do not guarantee future performance, underscoring the dynamic nature of trading strategies that may be adjusted based on new insights or market conditions.
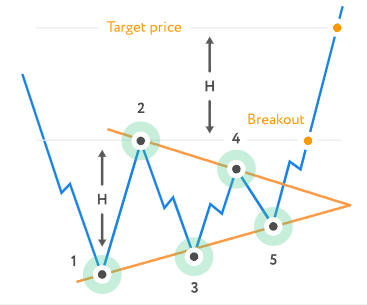
Ascending Triangle Pattern (may achieve 67-78% odds of success)
Characterized by a resistance level-tested horizontal upper boundary and an upward sloping lower boundary indicative of rising support levels, the Ascending Triangle pattern emerges. This pattern's breakout direction, upward or downward, determines the subsequent target price level. Typically found in markets lacking a clear direction, the narrowing of the market range suggests an impending investor consensus, potentially forecasting a significant uptrend.
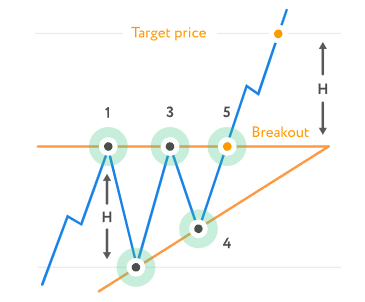
For traders, a breakout from the triangle suggests an opportunity to align with the prevailing upward trend. Entering a position at the upward breakout level and establishing an exit strategy based on the pattern's height added to the breakout point offers a methodical approach. A stop order placed at or below the breakout price can mitigate risks associated with adverse price movements. The pattern's visibility during an uptrend underscores its utility as a reliable signal for both entry and exit strategies, with trading volume serving as a critical indicator for potential price escalation.
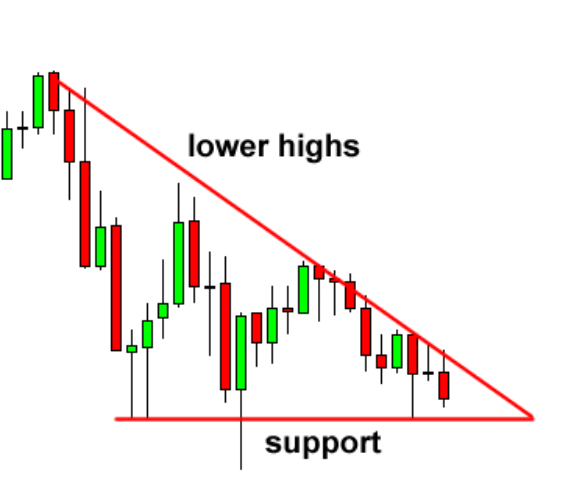
Descending Triangle Pattern (may achieve 77-81% odds of success)
The Descending Triangle pattern is identified by a consistent support level bounce and a descending resistance level, hinting at a bearish outlook. This pattern, like its ascending counterpart, indicates a market in equilibrium, with neither bulls or bears dominating.
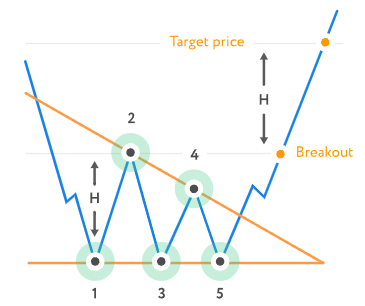
A breakout above the pattern's upper boundary prompts a buying strategy, favoring an upward trend. Calculating the target price involves adding the pattern's height to the breakout level. The inclusion of a stop order below the breakout price is advisable to limit losses should the market move unfavorably. Recognized primarily in downtrends, the descending triangle is typically viewed as a bearish signal, with volume playing a significant role in confirming the breakout's direction.
Symmetrical Triangle Patterns (may achieve 71-88% odds of success)
Both the Symmetrical Triangle Bottom and Top patterns emerge when prices fail to retest previous highs or lows, leading to the formation of converging trend lines. These patterns reflect a balanced market, with the potential for significant price movements upon a breakout.
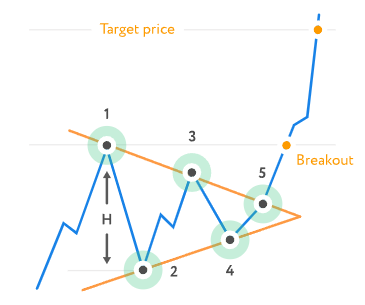
Traders are advised to position themselves in accordance with the breakout direction, buying at the breakout level with a target price determined by adding the pattern's height to the breakout point. The implementation of a stop order below the breakout price is recommended to minimize potential losses.
Tickeron's innovative approach to intraday pattern trading, empowered by Artificial Intelligence (AI), is transforming the way traders pinpoint accurate entry and exit points. By quickly scanning thousands of stocks and ETFs in minutes, a feat impossible for humans, this platform allows for the examination of patterns across multiple time frames—from 5 minutes to a day. Such capability sharpens the accuracy of predictions regarding target and breakout prices, along with confidence levels. Sergey Savastiouk, Ph.D., CEO and Founder of Tickeron, highlights the significant advancements in trading technology through the incorporation of user feedback into the AI-driven Intraday Pattern. This breakthrough speeds up the detection of bearish and bullish patterns from weeks to mere seconds, reflecting Tickeron's dedication to delivering dependable trading signals. Additionally, the AI's analysis of past pattern performances aids in forecasting future success rates, though it is important to remember that previous backtest outcomes are not indicative of future returns. This progress not only boosts efficiency but also meets the demands of cryptocurrency traders by applying classic price patterns over different time periods, aiming for enhanced trading outcomes and consistency.
Conclusion
Triangle patterns, including the Ascending Triangle Pattern, Descending Triangle Pattern, and Symmetrical Triangle Patterns, are foundational to understanding market dynamics through the lens of AI pattern recognition. These patterns, characterized by their narrowing trading ranges and culminating prices, indicate shifts in market sentiment and potential price movements. They embody the tug-of-war between supply and demand—reflected in the pattern's upper and lower trendlines, respectively—providing traders with insights into future price trajectories.
The integration of AI in trading, particularly through the lens of intraday patterns, offers a sophisticated tool for navigating the complexities of the financial markets. By analyzing historical data and current market trends, AI aids traders in making informed decisions, thus democratizing access to sophisticated trading strategies that were once the domain of highly skilled professionals.