Carisma Therapeutics, Inc. (CARM), a clinical-stage biopharmaceutical company focused on developing innovative immunotherapies, captured significant market attention in early June 2025. With a staggering 453.38% gain over the past five trading days and an average daily trading volume of 9 million shares, CARM has become a focal point for traders and investors alike. This article explores the drivers behind CARM’s explosive performance, integrates key market news from June 8, 2025, compares its movements with correlated stocks and inverse ETFs, and highlights the role of AI-driven tools like those offered by Tickeron.com in navigating its volatility.
Unprecedented Stock Performance
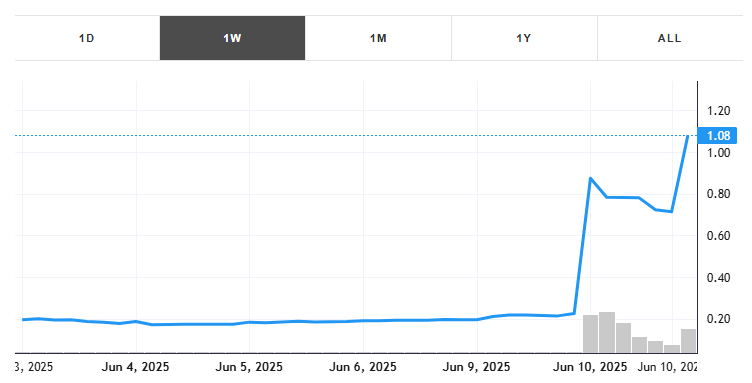
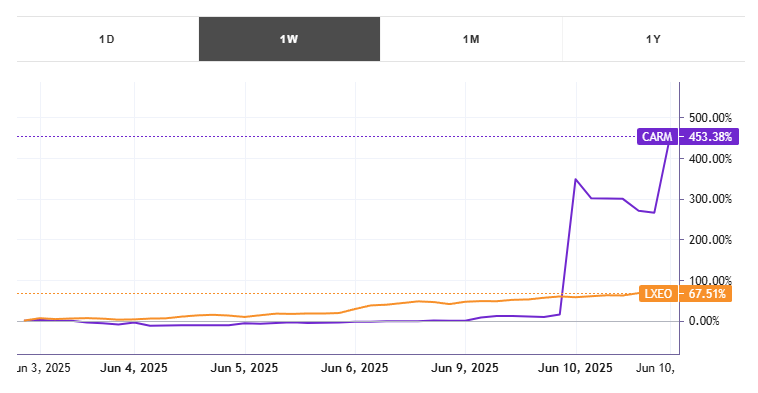
Over the five trading days ending June 10, 2025, CARM skyrocketed by 453.38%, with its price climbing from approximately $0.23 to over $1.27 at its peak. This surge was accompanied by an average daily trading volume of 9 million shares, a significant increase from its float of 21 million shares. On June 10 alone, pre-market trading saw volumes reach 36.69 million shares, indicating intense market interest. Despite this rally, CARM remains down 46% year-to-date and 81.71% over the past 12 months, reflecting a volatile trajectory. The stock’s market capitalization stands at approximately $30 million, underscoring its micro-cap status and inherent risk.
Catalysts Behind the Surge
The primary driver of CARM’s rally was a major restructuring announcement on June 9, 2025. Carisma disclosed plans to discontinue its CT-0525 program, reduce its workforce by 34%, and explore strategic alternatives, including asset sales, licensing opportunities, or a potential full exit. These cost-cutting measures extended the company’s cash runway into the second half of 2025, boosting investor confidence in its financial stability. Additionally, CARM’s ongoing collaboration with Moderna on in vivo CAR-M therapies continues to lend credibility to its technological platform, attracting institutional interest. Posts on X highlighted the restructuring as a “lean and focused” pivot, with 31% insider ownership signaling strong conviction.
Financial Health and Challenges
Despite the recent rally, Carisma faces significant financial hurdles. The company reported poor financial performance, with no revenue segments and substantial losses. Its valuation metrics, as noted by TipRanks’ AI analyst Spark, suggest an “Underperform” rating with no price target, reflecting skepticism about its long-term viability. The restructuring aims to address these challenges by streamlining operations and focusing on high-potential programs like CT-2401 and CT-1119. However, the potential wind-down of operations remains a risk, as cautioned by analysts, who describe the rally as a possible “sucker’s rally” or “dead cat bounce.”
Market Context on June 8, 2025
On June 8, 2025, global markets were buoyed by optimism surrounding U.S.-China trade talks set to commence in London. The S&P 500 was less than 3% from its record high, having climbed for two consecutive weeks, while the Dow Jones Industrial Average gained 443.13 points on June 6. Investors were focused on upcoming macroeconomic data, particularly the May Consumer Price Index (CPI) report, which was expected to provide insights into inflation trends amid evolving trade policies. In Asia, Hong Kong’s Hang Seng Tech Index rose 2.71%, driven by gains in tech stocks like Tencent and Meituan. These broader market dynamics likely amplified speculative interest in volatile micro-cap stocks like CARM.
Comparison with Correlated Stocks
To contextualize CARM’s performance, consider its correlation with other small-cap biotech stocks, such as Lexeo Therapeutics (LXEO). Like CARM, Lexeo is a clinical-stage company with a market cap of approximately $128.77 million and no current revenue. Lexeo’s stock has traded below its estimated fair value but benefits from a strong financial position, with $105.3 million in short-term assets and no debt. While LXEO has not experienced a rally comparable to CARM’s, its stability contrasts with CARM’s high-risk profile. Both stocks are sensitive to biotech sector sentiment, but CARM’s restructuring news has driven its outperformance in the short term.
Inverse ETFs and Hedging Strategies
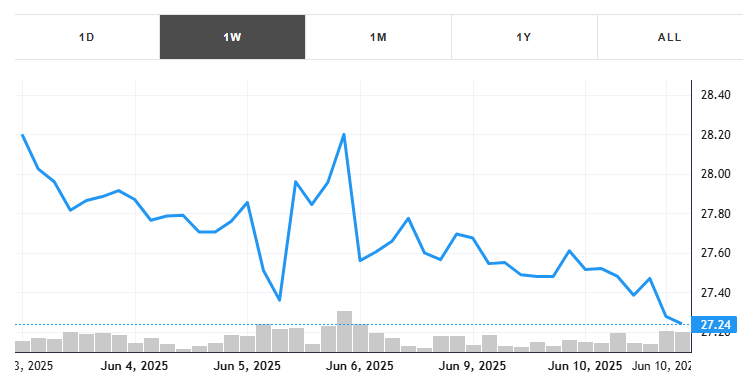
For traders seeking to hedge against CARM’s volatility, inverse ETFs like the ProShares UltraShort QQQ (QID) offer a counterplay. QID, which inversely tracks the Nasdaq-100 Index, is anti-correlated with CARM due to the latter’s biotech and micro-cap nature, which often moves independently of large-cap tech stocks. On April 15, 2025, QID reached $38.09, reflecting its sensitivity to Nasdaq downturns. Traders can use QID to capitalize on CARM’s potential pullbacks, especially given its overbought signals, such as RSI exiting overbought territory. Tickeron’s AI tools can identify optimal entry points for such strategies, enhancing risk management.
Tickeron’s AI-Powered Trading Tools
Tickeron.com, led by CEO Sergey Savastiouk, is revolutionizing trading with its Financial Learning Models (FLMs). These AI-driven models combine technical analysis with machine learning to detect market patterns with high precision. For a volatile stock like CARM, Tickeron’s Double Agent Trading Bot provides dual-perspective signals, identifying both bullish and bearish trends. The platform’s user-friendly bots, high-liquidity stock robots, and real-time insights empower traders to navigate CARM’s rapid price swings. With a reported 86.6% win rate across leveraged ETFs, Tickeron’s virtual agents offer a robust framework for informed decision-making in dynamic markets.
Daily Buy/Sell Signals
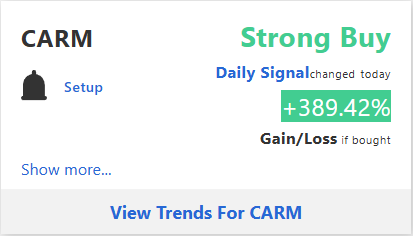
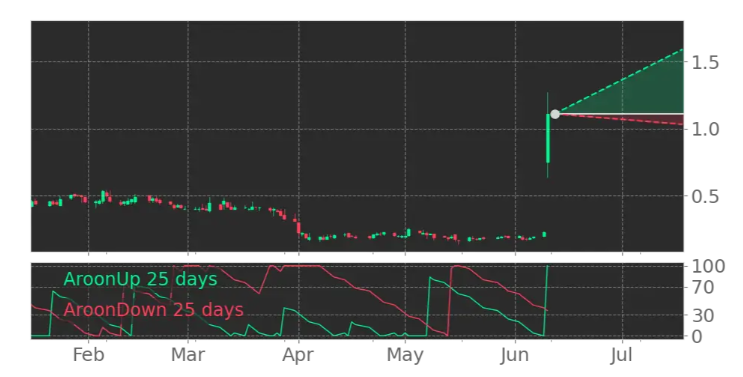
Aroon Indicator for CARM shows that an upward move is likely
CARM’s Aroon Indicator triggered a bullish signal on May 13, 2025. Tickeron’s AI detected that the AroonUp green line is above 70 while the AroonDown red line is below 30. When the up indicator moves above 70 and the down indicator remains below 30, it is a sign that the stock could be setting up for a bullish move. Traders may want to buy the stock or look to buy call options. AI looked at 183 similar instances where the Aroon Indicator showed a similar pattern. In 158 of the 183 cases, the stock moved higher in the days that followed. This puts the odds of a move higher at 86%.
Technical Analysis (Indicators)
Bullish Trend Analysis
The Momentum Indicator moved above the 0 level on June 05, 2025. You may want to consider a long position or call options on CARM as a result. In 64 of 79 past instances where the momentum indicator moved above 0, the stock continued to climb. The odds of a continued upward trend are 81%.
CARM moved above its 50-day moving average on June 09, 2025 date and that indicates a change from a downward trend to an upward trend.
Following a +21.93% 3-day Advance, the price is estimated to grow further. Considering data from situations where CARM advanced for three days, in 211 of 250 cases, the price rose further within the following month. The odds of a continued upward trend are 84%.
Notable companies
The most notable companies in this group are Regeneron Pharmaceuticals (NASDAQ:REGN), Incyte Corp (NASDAQ:INCY), Exelixis (NASDAQ:EXEL), Moderna (NASDAQ:MRNA), Sarepta Therapeutics (NASDAQ:SRPT), Arrowhead Pharmaceuticals (NASDAQ:ARWR), BioCryst Pharmaceuticals (NASDAQ:BCRX), Adaptive Biotechnologies Corp (NASDAQ:ADPT), Novavax (NASDAQ:NVAX), Nektar Therapeutics (NASDAQ:NKTR).
Industry description
Biotechnology involves genetic or protein engineering to produce medicines/therapies for treating and preventing ailments. The industry also provides crucial ingredients for diagnostics. This multi-billion-dollar industry is heavily focused on research and development, as companies attempt to continually come up with cutting-edge solutions for health. New discoveries for the treatment of diseases provide opportunities for growth for a company in this industry. Discoveries, however, must pass the regulatory approval from the U.S. Food and Drug Administration (FDA) before they can make it to markets. Amgen Inc., Gilead Sciences, Inc. and Celgene Corporation are examples of companies in this industry.
Market Cap
The average market capitalization across the Biotechnology Industry is 2.38B. The market cap for tickers in the group ranges from 151 to 333.72B. NONOF holds the highest valuation in this group at 333.72B. The lowest valued company is MYMX at 151.
High and low price notable news
The average weekly price growth across all stocks in the Biotechnology Industry was 8%. For the same Industry, the average monthly price growth was 18%, and the average quarterly price growth was 6%. KLTO experienced the highest price growth at 1,053%, while CERO experienced the biggest fall at -96%.
Volume
The average weekly volume growth across all stocks in the Biotechnology Industry was -7%. For the same stocks of the Industry, the average monthly volume growth was 41% and the average quarterly volume growth was 69%
Fundamental Analysis Ratings
The average fundamental analysis ratings, where 1 is best and 100 is worst, are as follows
Valuation Rating: 50
P/E Growth Rating: 84
Price Growth Rating: 59
SMR Rating: 90
Profit Risk Rating: 94
Seasonality Score: 10 (-100 … +100)
Conclusion
While CARM’s 453.38% surge reflects strong short-term momentum, its long-term prospects remain uncertain. The restructuring has extended its cash runway, but the lack of revenue and potential operational wind-down pose significant risks. Traders should monitor technical levels, such as the pre-market support at $0.23 and resistance at $0.95, as highlighted on X. Additionally, broader market factors, including trade policy outcomes and inflation data, could influence CARM’s trajectory. AI-driven tools from Tickeron.com can help traders capitalize on opportunities while managing downside risks.