


Analysis of SoFi Technologies' (SOFI) Stock: The Amazing 132% Increase That Hit 3-Year Highs
SoFi Technologies Inc. (SOFI) delivered one of the most impressive stock performances in the financial technology sector during the second quarter of 2025, with shares surging an extraordinary 132% from their April 7 low of $8.60 to the July 8 closing price of $19.95. This remarkable rally pushed the stock to 3-year highs, demonstrating the company's successful transformation from a student loan refinancer into a comprehensive digital financial services platform.
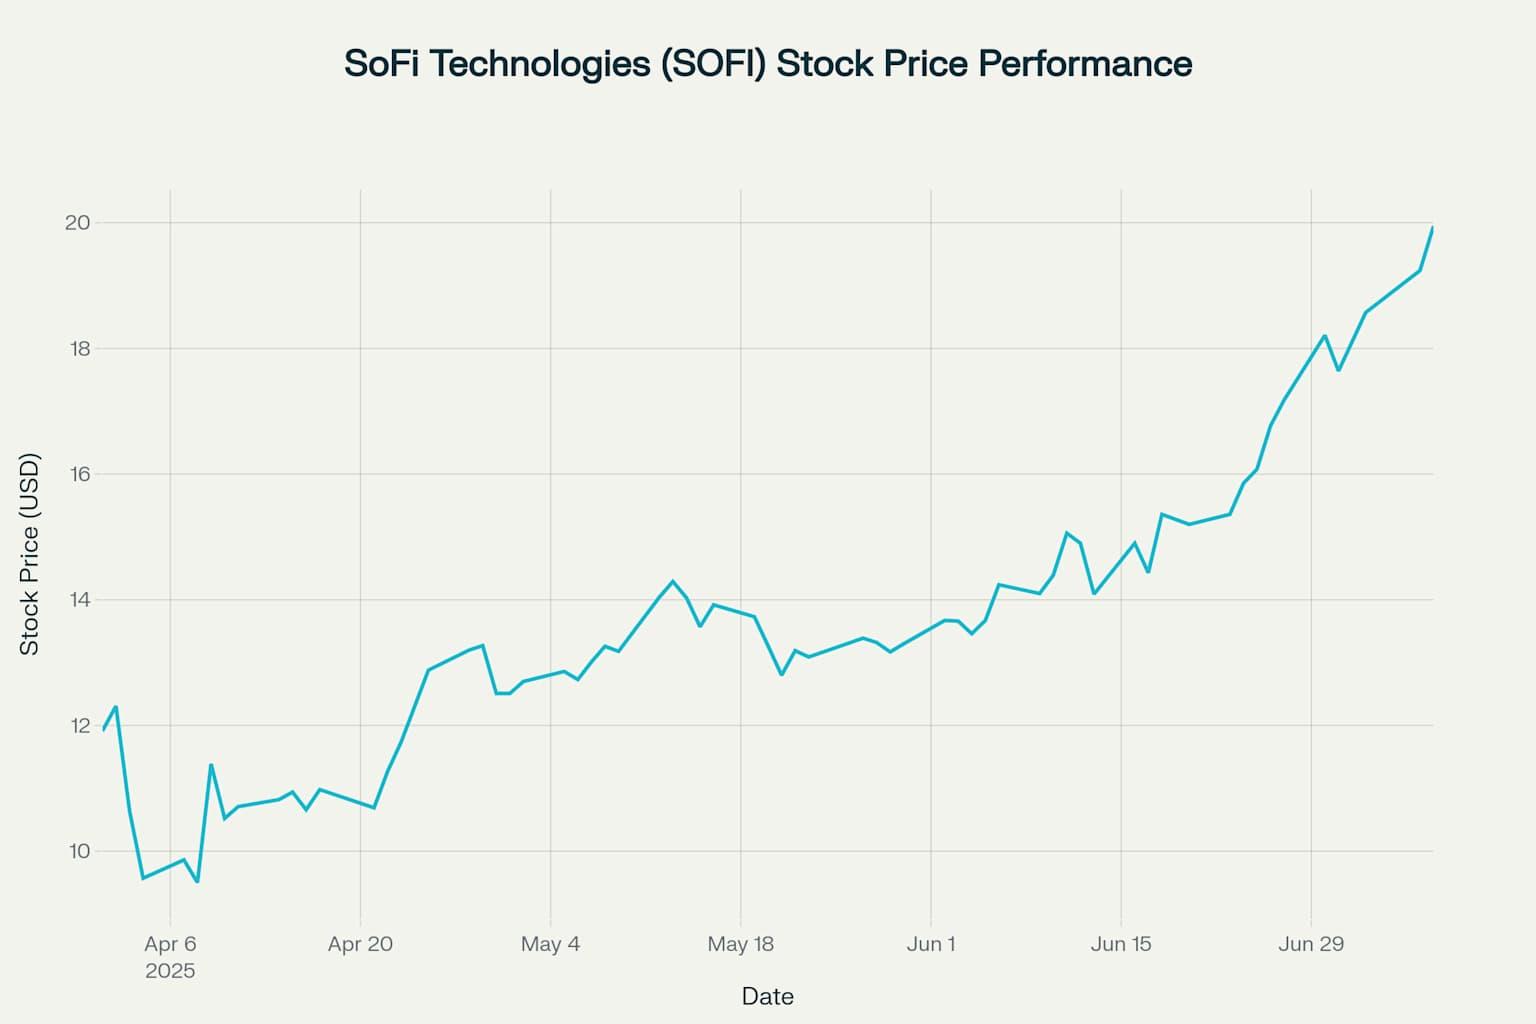
SoFi Technologies (SOFI) stock price chart showing remarkable 132% gain from April 7 low to July 8 close
The dramatic price appreciation was driven by multiple catalysts, including exceptional Q1 2025 financial results, strategic policy changes favoring private student lenders, expansion into private markets investing, and the anticipated return to cryptocurrency services. With over 10.9 million members and $27.3 billion in deposits, SoFi has positioned itself as a formidable player in the rapidly evolving fintech landscape.
Understanding SoFi Technologies: From Student Loans to Financial Super App
Company Overview and Business Model
SoFi Technologies, founded in 2011 at Stanford University, began as Social Finance with a mission to provide more affordable student loan refinancing options. The company has since evolved into a member-centric, one-stop shop for digital financial services that helps users borrow, save, spend, invest, and protect their money.
The company operates through three primary business segments:
- Lending Segment: Offers personal loans, student loans, home loans, and related servicing activities
- Technology Platform Segment: Provides technology services through Galileo and Technisys platforms to financial institutions
- Financial Services Segment: Includes SoFi Money (banking), SoFi Invest (investment platform), SoFi Credit Card, and other financial products
Strategic Acquisitions and Banking Charter
SoFi's transformation accelerated through strategic acquisitions, including the $1.2 billion acquisition of Galileo in 2020, which expanded the company into B2B fintech infrastructure. A pivotal moment came in 2022 when SoFi secured a national bank charter by acquiring Golden Pacific Bancorp, enabling the company to hold deposits and reduce funding costs significantly.
This banking charter has been crucial to SoFi's profitability journey, allowing the company to use member deposits to fund loans rather than relying on more expensive third-party funding sources.
Q1 2025 Financial Results: The Foundation for the Rally
Record-Breaking Performance Metrics
SoFi's Q1 2025 results provided the fundamental catalyst for the stock's remarkable performance, with the company delivering record financial results across multiple metrics:
Metric
Q1 2025 Value
Year-over-Year Growth
Adjusted Net Revenue
$771M
+33%
Net Income
$71M
+200%
Adjusted EBITDA
$210M
+46%
Fee-based Revenue
$315M
+67%
Earnings Per Share (EPS)
$0.06
+200%
Members (end of period)
10.9M
+34%
Total Products
15.9M
+35%
Lending Revenue
$413M
+27%
Financial Services Revenue
$303M
+101%
Technology Platform Revenue
$103M
+10%
Total Deposits
$27.3B
N/A
Segment Performance Analysis
The Financial Services segment emerged as a standout performer, with revenue more than doubling year-over-year to $303.1 million. This growth was primarily driven by strong adoption of SoFi Money accounts and the expansion of the Loan Platform Business.
The Lending segment maintained steady growth with revenues of $413.4 million, up 27% year-over-year, despite challenging macroeconomic conditions. The segment benefited from continued strong demand for personal loans and home loans.
The Technology Platform segment generated $103.4 million in revenue, up 10% year-over-year, demonstrating the value of SoFi's B2B infrastructure business through Galileo and Technisys.
Profitability Milestone and Margin Expansion
SoFi achieved a significant milestone by reporting GAAP net income of $71.1 million for Q1 2025, representing a 200% increase from the prior year. The company's adjusted EBITDA margin of 27% improved by 200 basis points year-over-year, demonstrating operational efficiency gains.
The company's focus on fee-based revenue proved particularly successful, with such revenue reaching a record $315.4 million, up 67% year-over-year. This diversification away from interest-dependent revenue streams has strengthened SoFi's financial profile and reduced risk.
The Policy Catalyst: Trump's Tax Bill and Student Loan Caps
Federal Student Loan Limitations Create Opportunity
One of the most significant catalysts for SoFi's stock surge was the passage of President Trump's "One Big Beautiful Bill Act" in July 2025, which imposed new caps on federal student loan borrowing. These limitations are expected to drive more borrowers toward private lenders like SoFi.
Under the new legislation:
- Graduate students can borrow a maximum of $20,500 per year, with a $100,000 lifetime limit
- Professional students (including medical and law students) can borrow up to $50,000 per year, with a $200,000 lifetime cap
- Parent PLUS loans are capped at $65,000 per student
Market Impact and SoFi's Competitive Position
The federal borrowing caps represent a significant reduction from current limits, where graduate students could previously borrow up to $138,500 and certain professional students up to $224,000. This change is expected to create a substantial funding gap that private lenders like SoFi are well-positioned to fill.
Wall Street analysts have noted that SoFi's strong market position in student lending and its focus on high-credit-quality borrowers make it particularly well-suited to benefit from this regulatory shift. As Devin Ryan of Citizens Financial Group noted, "SoFi holds a strong market position in student lending, and with several lenders scaling back in recent years, we anticipate the firm will significantly benefit from rising demand".
Strategic Expansion: Private Markets and Cryptocurrency
Democratizing Private Market Access
In July 2025, SoFi announced a strategic expansion into private markets investing, partnering with asset managers including Cashmere, Fundrise, and Liberty Street Advisors. This initiative provides SoFi's 10.9 million members with access to high-growth private companies such as OpenAI, SpaceX, Epic Games, and others.
The expansion features investment minimums starting at just $10, dramatically lowering the barrier to entry for private market investments that were traditionally available only to institutional investors and ultra-high-net-worth individuals. This democratization of access aligns with SoFi's broader mission of making financial services more accessible.
Cryptocurrency Services Return
Perhaps one of the most anticipated developments was SoFi's announcement of its return to cryptocurrency services in 2025. The company had previously discontinued crypto services in late 2023 as a condition of receiving its national bank charter.
The crypto reentry includes:
- Cryptocurrency trading (initially focusing on Bitcoin and Ethereum)
- Blockchain-powered international remittances
- Stablecoin offerings
- Crypto-backed borrowing
- Staking features
SoFi CEO Anthony Noto described the crypto relaunch as "day 1 of the type of innovation that can be driven via blockchain, crypto, and AI to make financial services faster, easier, safer, more accessible, and lower cost for our members".
Financial Performance Deep Dive: Sustainable Growth Model
Revenue Diversification Strategy
SoFi's transformation from a lending-focused company to a diversified financial services platform has been evident in its revenue mix evolution. The company's fee-based revenue now accounts for approximately 41% of total revenue on an annualized basis, with management expecting this to grow beyond 50%.
This diversification provides several advantages:
- Reduced interest rate sensitivity
- More predictable revenue streams
- Higher margins on fee-based services
- Lower capital requirements for growth
Member Growth and Engagement
SoFi's member base grew by 800,000 net new members in Q1 2025, bringing the total to 10.9 million members, representing a 34% year-over-year increase. This growth was accompanied by increased product adoption, with total products reaching 15.9 million, up 35% year-over-year.
The company's cross-selling success is evident in the average number of products per member, which continues to increase as SoFi expands its product offerings and enhances the integrated user experience.
Capital Efficiency and Risk Management
SoFi's banking charter has enabled significant improvements in capital efficiency. The company's total deposits of $27.3 billion provide a stable, low-cost funding source for its lending operations. This has resulted in approximately $515 million in annual funding cost savings compared to previous third-party funding arrangements.
The company maintains strong capital ratios, with Common Equity Tier 1 (CET1) capital ratio of 15.3% as of March 31, 2025, well above regulatory requirements. This strong capital position provides flexibility for future growth initiatives and dividend potential.
Market Position and Competitive Advantages
Technology Platform Differentiation
SoFi's vertically integrated technology platform provides significant competitive advantages. The company's Galileo platform powers not only SoFi's own services but also serves as infrastructure for numerous other fintech companies, creating a diversified revenue stream and network effects.
The integration of artificial intelligence and machine learning into SoFi's platform enables:
- Enhanced underwriting capabilities
- Personalized financial recommendations
- Improved fraud detection
- Automated customer service
Member-Centric Approach
SoFi's member-centric philosophy differentiates it from traditional financial institutions. The company focuses on building long-term relationships with high-earning, financially responsible customers, resulting in:
- Lower default rates compared to industry averages
- Higher customer lifetime value
- Strong brand loyalty and referral rates
- Premium pricing power
Valuation Analysis: Premium Metrics Reflect Growth Expectations
Current Valuation Metrics
As of July 2025, SoFi trades at premium valuation multiples that reflect high growth expectations:
- Forward P/E ratio: Approximately 68x
- Price-to-Sales ratio: 7.55x
- Market capitalization: $22.05 billion
- Enterprise value: Significantly higher than traditional banks
Analyst Perspectives and Price Targets
Wall Street analysts maintain a mixed but generally positive outlook on SoFi, with a consensus rating of "Hold" and an average price target of approximately $14.62, suggesting potential downside from current levels. However, price targets range from a low of $8.00 to a high of $20.00, indicating significant disagreement among analysts.
Key analyst concerns include:
- High valuation multiples compared to traditional financial institutions
- Regulatory risks in the fintech sector
- Interest rate sensitivity despite revenue diversification
- Competitive pressures from both traditional banks and fintech rivals
Long-term Value Creation Potential
Despite near-term valuation concerns, SoFi's long-term value creation potential remains substantial, driven by:
- Significant addressable market in financial services
- Technology-enabled cost advantages
- Network effects from platform growth
- Potential for market share gains in key segments
Future Outlook: Growth Catalysts and Strategic Priorities
2025 Guidance and Expectations
SoFi raised its full-year 2025 guidance following strong Q1 results:
- Adjusted net revenue: $3.235 billion to $3.310 billion
- Adjusted EBITDA: $875 million to $895 million
- Continued member growth: Targeting 30% growth
- Revenue growth: Expecting 20%+ growth rates
Strategic Priorities for 2025-2026
SoFi's strategic roadmap focuses on several key areas:
- Crypto Integration: Full rollout of cryptocurrency services by end of 2025
- International Expansion: Global remittance services and potential market expansion
- Product Innovation: Continued development of AI-powered financial tools
- Partnership Growth: Strategic alliances to expand addressable market
- Regulatory Compliance: Maintaining strong risk management as the company scales
Long-term Vision: Becoming a Top 10 Financial Institution
CEO Anthony Noto has articulated an ambitious vision for SoFi to become a "top 10 financial institution". While the specific metric for this goal remains unclear, it reflects management's confidence in the company's growth trajectory and market opportunity.
To achieve this vision, SoFi will need to:
- Scale its member base to 50+ million members
- Expand geographic presence beyond the U.S. market
- Diversify revenue streams further into insurance, wealth management, and business banking
- Maintain technological leadership in digital financial services
Risk Factors and Challenges
Regulatory and Policy Risks
SoFi faces several regulatory risks that could impact future performance:
- Banking regulation changes that could affect the company's charter benefits
- Consumer protection regulations in the fintech sector
- Cryptocurrency regulations that could impact the crypto services rollout
- Student loan policy changes that could affect the lending business
Competitive Landscape
The fintech sector remains highly competitive, with SoFi facing challenges from:
- Traditional banks investing heavily in digital transformation
- Pure-play fintech companies with specialized offerings
- Big tech companies entering financial services
- Cryptocurrency exchanges expanding into traditional banking
Economic Sensitivity
Despite revenue diversification, SoFi remains sensitive to economic conditions:
- Interest rate changes affecting lending margins
- Economic downturns impacting loan demand and credit quality
- Employment levels affecting target customer base
- Consumer spending patterns influencing product adoption
Investment Thesis: Balancing Growth Potential with Valuation Concerns
Bull Case Arguments
The bull case for SoFi centers on several compelling factors:
- Market Leadership Position: SoFi's early-mover advantage in digital-first financial services
- Revenue Diversification: Successful transition to fee-based revenue model
- Technology Platform: Valuable B2B infrastructure business through Galileo
- Regulatory Tailwinds: Federal student loan caps creating market opportunity
- Innovation Pipeline: Crypto services and private markets expansion
Bear Case Considerations
The bear case highlights potential challenges:
- Valuation Concerns: Premium multiples may not be sustainable
- Competitive Pressure: Increasing competition from well-funded rivals
- Regulatory Risks: Potential policy changes affecting key business segments
- Economic Sensitivity: Vulnerability to economic downturns
- Execution Risk: Challenges in scaling operations and maintaining growth
Balanced Perspective
SoFi represents a high-growth, high-risk investment opportunity in the evolving fintech sector. The company's strong execution in Q1 2025, combined with favorable policy developments and strategic expansion initiatives, provides multiple catalysts for continued growth.
However, investors must carefully consider the premium valuation and inherent risks associated with a rapidly growing fintech company in a competitive and regulated industry.
Tickeron: AI-Enhanced Trading Tools for the Fintech Frontier
As fintech leaders like SoFi revolutionize how people access and manage money, platforms like Tickeron empower traders to seize opportunities in this rapidly changing landscape. Tickeron blends artificial intelligence with real-time market data to uncover trade setups, forecast price trends, and support smarter, faster decision-making—ideal for navigating high-growth sectors like digital banking, crypto, and tech.
From fintech momentum trades to tactical swing strategies, Tickeron equips traders with powerful tools tailored to today’s fast-moving markets.
Key features include:
- AI Agents (60min / 15min / 5min): Machine-learning agents that generate intraday trading ideas based on short-term market behavior.
- AI Pattern Search Engine that identifies breakout setups with projected price targets and statistical confidence levels.
- Trend Prediction Engine offering early-session entry/exit forecasts based on real-time price dynamics.
- Real-Time Signal Screener delivering live buy/sell signals across stocks, ETFs, crypto, and more.
With SoFi at the forefront of fintech evolution, Tickeron helps traders stay ahead of the curve—turning market data into actionable insights.
Conclusion: A Transformative Period for SoFi Technologies
SoFi Technologies' remarkable 132% stock price rally from April to July 2025 represents more than just a short-term trading opportunity—it reflects the company's successful transformation into a comprehensive digital financial services platform. The confluence of strong financial results, favorable regulatory changes, strategic expansion into new markets, and the anticipated return to cryptocurrency services has positioned SoFi for continued growth.
The company's record Q1 2025 performance, featuring 33% revenue growth and 200% earnings growth, demonstrates the effectiveness of its diversified business model and member-centric approach. The upcoming federal student loan caps create a significant market opportunity that plays directly to SoFi's strengths in private lending.
As SoFi prepares to report Q2 2025 results on July 29, 2025, investors will be watching closely for continued execution of the company's growth strategy. With analyst expectations for $0.06 EPS and $801.8 million in revenue, the company faces the challenge of maintaining its growth trajectory while managing valuation expectations.
SOFI's Stochastic Oscillator is staying in oversold zone for 3 days
The price of this ticker is presumed to bounce back soon, since the longer the ticker stays in the oversold zone, the more promptly an uptrend is expected.

Technical Analysis (Indicators)
Bullish Trend Analysis
The 10-day moving average for SOFI crossed bullishly above the 50-day moving average on June 23, 2026. This indicates that the trend has shifted higher and could be considered a buy signal. In of 12 past instances when the 10-day crossed above the 50-day, the stock continued to move higher over the following month. The odds of a continued upward trend are .
Following a 3-day Advance, the price is estimated to grow further. Considering data from situations where SOFI advanced for three days, in of 296 cases, the price rose further within the following month. The odds of a continued upward trend are .
SOFI may jump back above the lower band and head toward the middle band. Traders may consider buying the stock or exploring call options.
The Aroon Indicator entered an Uptrend today. In of 210 cases where SOFI Aroon's Indicator entered an Uptrend, the price rose further within the following month. The odds of a continued Uptrend are .
Bearish Trend Analysis
The Momentum Indicator moved below the 0 level on July 15, 2026. You may want to consider selling the stock, shorting the stock, or exploring put options on SOFI as a result. In of 89 cases where the Momentum Indicator fell below 0, the stock fell further within the subsequent month. The odds of a continued downward trend are .
The Moving Average Convergence Divergence Histogram (MACD) for SOFI turned negative on July 15, 2026. This could be a sign that the stock is set to turn lower in the coming weeks. Traders may want to sell the stock or buy put options. Tickeron's A.I.dvisor looked at 55 similar instances when the indicator turned negative. In of the 55 cases the stock turned lower in the days that followed. This puts the odds of success at .
SOFI moved below its 50-day moving average on July 22, 2026 date and that indicates a change from an upward trend to a downward trend.
Following a 3-day decline, the stock is projected to fall further. Considering past instances where SOFI declined for three days, the price rose further in of 62 cases within the following month. The odds of a continued downward trend are .
Fundamental Analysis (Ratings)
The Tickeron Price Growth Rating for this company is (best 1 - 100 worst), indicating slightly worse than average price growth. SOFI’s price grows at a lower rate over the last 12 months as compared to S&P 500 index constituents.
The Tickeron PE Growth Rating for this company is (best 1 - 100 worst), pointing to worse than average earnings growth. The PE Growth rating is based on a comparative analysis of stock PE ratio increase over the last 12 months compared against S&P 500 index constituents.
The Tickeron Valuation Rating of (best 1 - 100 worst) indicates that the company is significantly overvalued in the industry. This rating compares market capitalization estimated by our proprietary formula with the current market capitalization. This rating is based on the following metrics, as compared to industry averages: P/B Ratio (2.025) is normal, around the industry mean (4.375). SOFI has a moderately high P/E Ratio (37.933) as compared to the industry average of (18.428). Projected Growth (PEG Ratio) (0.811) is also within normal values, averaging (1.181). Dividend Yield (0.000) settles around the average of (0.069) among similar stocks. P/S Ratio (5.627) is also within normal values, averaging (6.435).
The Tickeron SMR rating for this company is (best 1 - 100 worst), indicating weak sales and an unprofitable business model. SMR (Sales, Margin, Return on Equity) rating is based on comparative analysis of weighted Sales, Income Margin and Return on Equity values compared against S&P 500 index constituents. The weighted SMR value is a proprietary formula developed by Tickeron and represents an overall profitability measure for a stock.
The Tickeron Profit vs. Risk Rating rating for this company is (best 1 - 100 worst), indicating that the returns do not compensate for the risks. SOFI’s unstable profits reported over time resulted in significant Drawdowns within these last five years. A stable profit reduces stock drawdown and volatility. The average Profit vs. Risk Rating rating for the industry is 77, placing this stock worse than average.
Notable companies
Industry description
Market Cap
High and low price notable news
Volume
Fundamental Analysis Ratings
The average fundamental analysis ratings, where 1 is best and 100 is worst, are as follows

Advertisement
General Information
Industry SavingsBanks
Advertisement