In the context of real-time pattern trading, the odds of success are calculated by Artificial Intelligence (AI) to determine the likelihood that a strategy effective in past conditions will continue to perform well. This involves analyzing historical patterns and outcomes across various stocks and ETFs to predict future performance. Especially in intraday trading, identifying the best entry and exit points quickly is critical. The vast number of stocks and ETFs makes this task daunting for individuals, but AI manages it efficiently by not only pinpointing these moments but also evaluating their past performance through backtesting. This provides a statistical foundation for forecasting the success of future transactions, giving traders a significant advantage.
The study of Broadening Formation patterns offers insight into the nuanced behaviors of financial markets, capturing the essence of escalating price volatility through its unique structural representation. This pattern emerges as two divergent trend lines, one ascending and the other descending, graphically portraying a widening trajectory. Often materializing subsequent to notable fluctuations in security prices, this formation is typified by a sequence of progressively higher pivot highs and deeper pivot lows.
Instant Search of Intraday Patterns
Intraday trading, characterized by a brisk pace, involves time frames ranging from 5 minutes to 30 minutes, falling under the category of Day Trading which may require instant search of intraday patterns. For those engaging in slightly longer durations, from 1 hour to potentially days, Swing Trading offers an alternative approach. The AI's capability extends across these varied time spans, with each candle potentially encapsulating different time frames, from as brief as 5 minutes to as extended as 4 hours and even 1 day.
The inception of AI in trading has revolutionized the approach to identifying Intraday Patterns. Scanning thousands of stocks and ETFs every minute, the AI system is adept at discovering patterns across multiple time frames, including 5 minutes, 15 minutes, 30 minutes, 1 hour, and 1 day. This broad spectrum ensures that traders can tailor their strategies to either Day Trading or Swing Trading, depending on their time frame preference and trading style. Upon identifying these patterns, AI proceeds to predict vital trading metrics such as target prices and breakout prices, along with confidence levels and other pertinent statistics. This process simplifies the trading strategy, allowing traders to specify their criteria and let AI handle the complex analysis.
Pattern Odds of Success powered by AI Backtesting
The reliability of AI in trading is further enhanced through rigorous backtesting. This procedure evaluates how identified patterns would have performed historically, thus offering a glimpse into their potential future success. By simulating results, such as win/loss ratios, under retrospective conditions, traders gain insight into the effectiveness of their strategies. It's crucial to recognize, however, that past hypothetical backtest results do not guarantee future returns. This acknowledgment underscores the dynamic nature of financial markets and the continuous evolution of trading strategies for optimal performance.
Broadening Bottom: A Bullish Reversal Indicator (may achieve 74-81% odds of success)
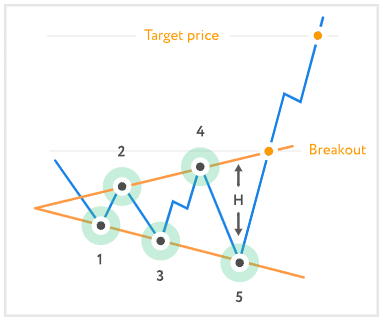
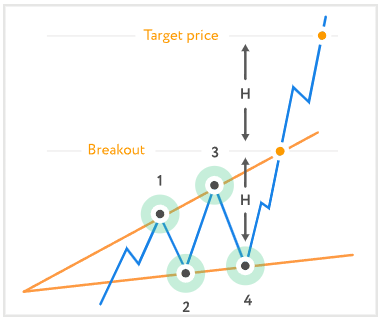
The Broadening Bottom pattern, emblematic of a bullish reversal, manifests as two diverging lines that together form a triangular shape, with the distance between these lines expanding as the pattern develops. For validation, each line of the triangle must be touched a minimum of twice. Distinguished by the security's price marking higher highs and lower lows in an expanding trend, the pattern suggests an impending upward or downward price movement based on the breakout direction. Unlike its counterpart, the Broadening Top, this pattern is preceded by a downward trend in the security price. Traders are advised to engage in trades aligned with the upward trend following a breakout above the pattern's upper boundary, employing strategies such as purchasing securities or call options at the breakout point. To ascertain an exit strategy, the target price is calculated by adding the pattern's height to the breakout price, with a stop order recommended to mitigate losses should the price direction reverse unexpectedly. This pattern typifies scenarios of heightened volatility, often reflecting investor uncertainty and indecision.
Broadening Top: Signaling Potential Reversals (may achieve 74-81% odds of success)
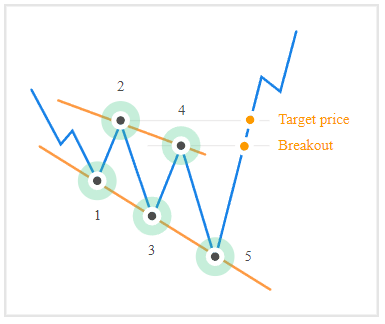
Similarly, the Broadening Top pattern indicates potential price movements, with traders encouraged to initiate trades reflecting an upward trend upon a breakout from the pattern's upper limit. The target exit price is determined in the same manner as the Broadening Bottom, with protective stop orders recommended to minimize losses. This pattern is identifiable by higher highs and lower lows within a widening trend, occurring after a price rise, thereby differing from the Broadening Bottom by its prior price trend.
Ascending and Descending Broadening Wedges (may achieve 71-82% odds of success)
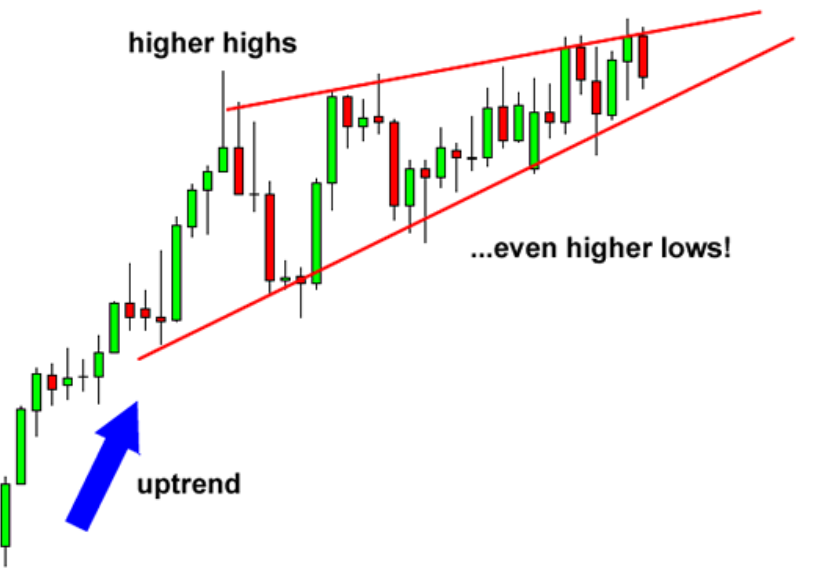
The Ascending Broadening Wedge is characterized by higher highs and higher lows, suggesting a breakout in either direction after a period of strategic buying by large investors. This pattern reflects a dynamic where initial buying spurs further market participation, followed by selling from value investors, leading to a potential price breakout.
Ascending
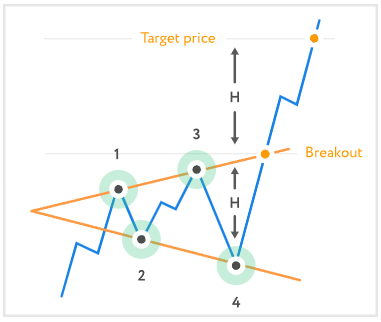
Descending
Conversely, the Descending Broadening Wedge, marked by lower lows and lower highs, encapsulates a downtrend potentially reversing upon breakout. This pattern emerges from a distribution phase where large investors' extended selling leads to a market reaction, eventually inviting buying from value investors, hinting at a forthcoming price increase.
Key Takeaways and Profit Strategies
Broadening formations, characterized by a megaphone-like widening pattern, signify a market in discord over a security's price, leading to increased volatility. These patterns are relatively rare, often aligning with periods of significant market uncertainty such as geopolitical tensions or economic policy shifts, and may signal investor indecision between bullish and bearish outlooks.
For traders, particularly swing traders and day traders, broadening formations present opportunities to capitalize on volatility rather than directional trends. These traders may employ technical analysis to anticipate price reversals and execute timely trades. The expanding gap between the pattern's trend lines increases potential profit margins for trades within this formation, making it an intriguing scenario for those seeking to exploit short-term market movements.
Tickeron's innovative approach to intraday pattern trading significantly advances the field by utilizing artificial intelligence (AI). This technique enables the rapid identification of precise entry and exit points, analyzing thousands of stocks and ETFs within minutes—a feat unattainable by humans. The platform's versatility is evident in its capacity to examine patterns over a wide range of time frames, from 5 minutes to 4 hours, and even daily, thereby increasing the accuracy of predictions, including target and breakout prices, along with confidence levels. Sergey Savastiouk, Ph.D., CEO and Founder of Tickeron, highlights the critical role of incorporating extensive user feedback into the AI-driven Intraday Pattern, marking a significant advancement in trading technology. This breakthrough considerably shortens the time needed to identify both bearish and bullish patterns, from weeks to mere seconds, reflecting Tickeron's dedication to delivering dependable trading signals. Additionally, the AI's analysis of historical pattern performance aids in forecasting future success probabilities, though it's important to acknowledge that previous hypothetical backtest results do not ensure future outcomes. This development not only improves efficiency but also meets the unique demands of cryptocurrency traders by applying traditional price patterns across different time spans, aiming for enhanced trading results and consistency.
Conclusion
The integration of AI into trading practices marks a significant advancement in the identification and execution of profitable trades. By automating the detection of Intraday Patterns and providing a framework for their historical evaluation, AI empowers traders with the tools necessary for informed decision-making. Whether engaging in the fast-paced environment of Day Trading or navigating the extended timelines of Swing Trading, AI's versatility across different time frames aligns with a broad range of trading objectives. The study of patterns like the Broadening Formation further enriches our understanding of market dynamics, highlighting the intricate behaviors and volatility inherent in financial markets. As we continue to explore the synergies between AI and trading, the potential for enhanced market analysis and strategy development becomes increasingly evident, promising a more informed and strategic approach to trading.