In the complex realm of financial markets, the "Odds of Success" denotes the likelihood, as determined by Artificial Intelligence (AI), that a trading strategy which has shown efficacy under past conditions will continue to perform well. This metric is derived from a thorough analysis of historical trading patterns and their outcomes across a wide array of stocks and ETFs, serving as a statistical foundation for forecasting future performance. Moreover, the use of chart patterns, such as the Cup and Handle, Flag, and Head and Shoulders, is crucial for predicting future price movements. These patterns are highlighted for their predictive accuracy and reliability, providing valuable insights into their integration within trading strategies and granting traders and investors a significant strategic advantage.
Artificial Intelligence (AI) revolutionizes the way we identify entry and exit points in the market by scanning thousands of stocks and ETFs for patterns within minutes—a task utterly unfeasible for humans. AI doesn't just identify these patterns; it also evaluates their historical performance, calculating success rates to predict future outcomes more accurately.
Instant Search of Intraday Patterns
Every minute, AI's Intraday Patterns system scans the market, seeking patterns across a diverse range of time frames—from as short as 5 minutes to as long as 1 day. This flexibility allows for the identification of patterns within a single candlestick, which can encompass time frames varying from 5 minutes to 4 hours, and even up to a full day. Based on the selected time frame, patterns can be categorized into Day Trading, for those ranging from 5 minutes to 30 minutes, and Swing Trading, for patterns extending 1 hour and beyond. Upon detection, the system forecasts essential metrics such as target prices, breakout prices, confidence levels, among others, tailoring its analysis to the trader's specific needs with remarkable precision.
Pattern Odds of Success powered by AI Backtesting
The robustness of Intraday Patterns is further underscored through rigorous backtesting. This process involves the retroactive application of a model to historical data, designed with the benefit of hindsight. Such simulated results include win/loss percentages and other critical statistics, providing a hypothetical gauge of the pattern's performance. It's important to note, however, that these backtested results, while insightful, are neither injective nor guarantee future performance. The fluid nature of financial markets means strategies may be adjusted over time to achieve desired outcomes, and alternative modeling techniques could yield significantly different results.
The Cup and Handle Pattern
Origins and Structure: The Cup and Handle pattern, first identified by William J. O'Neil in 1988, resembles a teacup. This pattern consists of a "cup" with a rounded bottom representing a period of consolidation, followed by a "handle," which indicates a slight downward drift in price. The pattern culminates with a breakout from the handle, suggesting an imminent upward price movement.
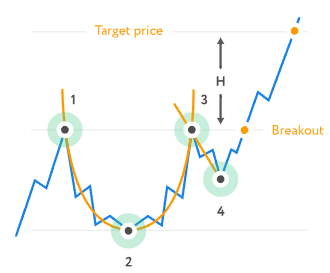
Trading Insights: This pattern is a bullish signal that predicts the continuation of an uptrend. Traders often look for a decrease in volume during the formation of the handle and an increase in volume at the point of breakout, which confirms the pattern's predictive power. The duration of the pattern can range from several weeks to over a year, making it versatile for various trading timelines.
Key Points:
- A longer and more rounded cup suggests a stronger bullish signal.
- The depth of the cup is crucial; a shallow cup indicates stability, while a deep cup may signal volatility.
- Volume plays a significant role, with lower volume in the cup's base and higher volume at the breakout point being ideal.
The Flag Pattern (may achieve 75% odds of success)
Characteristics and Dynamics: The Flag pattern emerges during a strong, linear price movement (the flagpole), followed by a brief consolidating counter-trend move (the flag), resembling a flag on a flagpole. This pattern can be bullish or bearish, indicating a continuation of the prevailing trend upon completion of the consolidation phase.
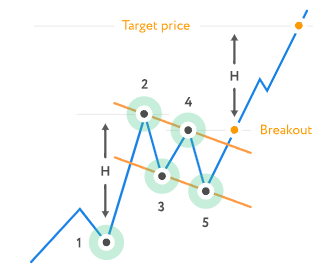
Trading Approach: The Flag pattern is favored for its short-term predictive capabilities. The key to trading this pattern is to identify the consolidation following a sharp price movement and to anticipate the trend's resumption post-consolidation. Entry points are typically set following a breakout from the flag formation, with volume analysis providing additional confirmation.
Key Points:
- The flag should not exceed the midpoint of the flagpole for a valid pattern.
- Volume should decrease during the formation of the flag and increase upon breakout.
- The pattern typically forms within one to four weeks, making it suitable for short-term trading strategies.
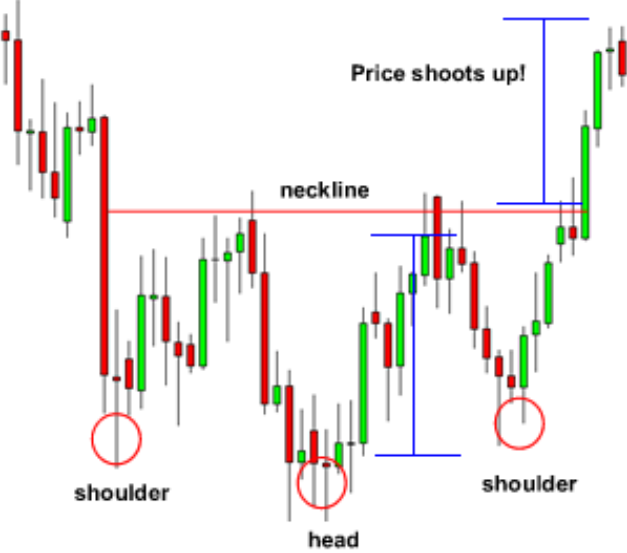
The Head and Shoulders Pattern (may achieve 75% odds of success)
Pattern Description and Significance: The Head and Shoulders pattern is revered for its ability to forecast a trend reversal from bullish to bearish. It features three peaks: two shoulders of similar height with a higher head between them. This pattern signals the culmination of an upward trend and the beginning of a downward movement.
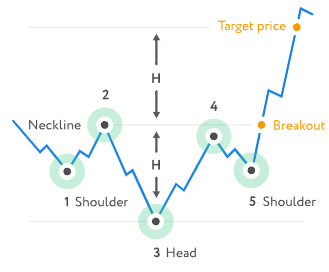
Implementation in Trading: The recognition of this pattern allows traders to set strategic entry, stop-loss, and target levels. The completion of the right shoulder followed by a breakout below the neckline serves as a sell signal, with volume analysis enhancing the decision-making process.
Key Points:
- The pattern is more reliable when it forms over a longer period.
- Volume should ideally decrease during the formation of the right shoulder and increase as the price breaks below the neckline.
- The distance from the head to the neckline can be used to set profit targets by projecting this distance downward from the breakout point.
Tickeron’s cutting-edge approach to intraday pattern trading, leveraging Artificial Intelligence (AI), revolutionizes the process of identifying precise entry and exit points by scanning thousands of stocks and ETFs within minutes—a task beyond human capability. This platform offers the flexibility of analyzing patterns over diverse time frames, ranging from 5 minutes to 4 hours and up to a day, thereby enhancing the precision of forecasts including target prices, breakout prices, and confidence levels. The integration of extensive user feedback into the AI-driven Pattern Search Engine, as emphasized by Sergey Savastiouk, Ph.D., CEO and Founder of Tickeron, signifies a major leap in trading technology. This innovation accelerates the identification of both bearish and bullish patterns from weeks to seconds, underscoring Tickeron's commitment to providing reliable trading signals. Furthermore, the AI's ability to evaluate historical pattern performance enables the prediction of future success probabilities, although it's crucial to note that past hypothetical backtest results do not guarantee future returns. This development not only enhances efficiency but also caters to the specific needs of cryptocurrency traders through the use of classic price patterns across various time intervals, promising improved trading performance and consistency.
Conclusion
The Cup and Handle, Flag, and Head and Shoulders patterns offer valuable insights into potential market movements, each with distinct signals that cater to different trading strategies and time frames. While these patterns provide a solid foundation for technical analysis, it is essential for traders to incorporate other indicators and analysis methods to validate their trading decisions. Understanding the subtleties and key points of these patterns enhances one's ability to navigate the complexities of the financial markets with greater confidence and precision.