XLE provides broad exposure to the energy sector through a market-capitalization-weighted approach focused on large-cap integrated oil and gas companies, while XOP targets a narrower exploration and production subsector with a modified equal-weighted methodology. XLE maintains a significantly lower expense ratio of 0.08% compared to XOP 's 0.35%, offering greater cost efficiency for long-term investors seeking sector allocation.
XLE is a passively managed ETF tracking the Energy Select Sector Index, holding approximately 24 S&P 500 energy stocks with a concentrated portfolio where the top three names — XOM , CVX , and COP — account for nearly half of net assets. The energy sector has been the top-performing S&P 500 sector in 2026, buoyed by the Iran conflict, restricted Strait of Hormuz transit, and WTI crude prices that more than doubled from their late-2025 lows before settling in the $75–$85 range.
VDE surged approximately 11% over the past 30 days, driven by a sharp rally in crude oil prices that pushed Brent above $100 per barrel and WTI near $92. Escalating geopolitical tensions in the Middle East — including Houthi attacks on Saudi oil tankers in the Red Sea and renewed U.S.-Iran hostilities — injected a substantial risk premium into energy markets.
XLE maintains a long-term uptrend, with the price trading significantly above the 200-day simple moving average at 48.30. Recent price action reflects a short-term pullback of approximately 6.86% over the past 20 days, leading to consolidation near the 50-day SMA of 57.40.
Strong Uptrend: OIH is in a robust bullish trend, trading significantly above all major moving averages, with year-to-date gains exceeding 54% and over 104% in the past year. Moving Averages Bullish: Price stands well above the 50-day MA at 422.80 and 200-day MA at 408.94, confirming upward momentum across short- and long-term horizons.
A jump in the Producer Price Index from 0.3% to around 0.7% month‑over‑month signals that wholesale inflation is re‑accelerating, delaying Fed rate‑cut hopes and reviving the “higher for longer” rates narrative.business.
Likely winners in this environment include energy and commodity producers (XOM, CVX, TTE, COP), inflation‑resilient financials (JPM, BAC), and real‑asset plays like pipelines and infrastructure, which can pass through higher prices; ETFs like XLE, XOP, XLF, DBA, GLD offer diversified exposure.
Top hedge funds like Millennium, Citadel, and Bridgewater showed limited direct accumulation of penny stocks in Q4 2025 13F filings, but rotations into biotech, energy, and defense sectors highlight indirect interest in low-priced plays under $5.
New entries and increased positions focused on volatile sectors like biotech (e.g., ABCL) and energy (e.g., AMPY), with full exits from overvalued names signaling a hunt for undervalued pennies amid market uncertainty.
Crude’s explosive war‑driven spike faded on March 9 because the market suddenly started to price less extreme, shorter‑lived supply risk and more policy intervention, not a multi‑month shortage. WTI, which had briefly traded above 115–120 dollars on Iran‑war headlines and Strait of Hormuz fears, slid back toward the high‑80s as traders digested G7 reserve‑release talk, Trump’s comments about a “brief” war, and the reality that prices had run far ahead of fundamentals.
Oil companies, especially exploration companies, have rallied sharply since the end of October.The SPDR S&P Oil & Gas Exploration & Production ETF (XOP) rallied 89.7% from the October low to last week’s high.
The oil services industry got hit as hard as any during the first quarter of 2020.The questions is, can the stocks keep the rally going with earnings expected to be down compared to last year’s results?
I put together the following table to show where the EPS estimates are for each company and how that compares to Q4 2019 and to the third quarter.
The gains seemed to be propelled by vaccine news and the hope that the world economy would get back on track sooner than thought.
The Energy Select Sector SPDR (XLE) gained 56% from its October low to its high a few weeks ago.Unfortunately the weekly stochastic readings made a bearish crossover last week and appear as though they may be headed out of overbought territory—a possible bearish signal.
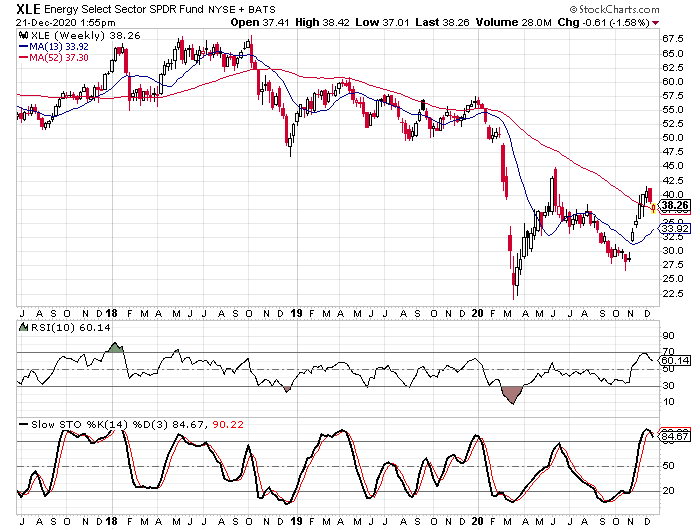
The SPDR S&P Oil & Gas Exploration & Production ETF (XOP) experienced an even greater gain, rallying 66.9% from its October low to its high two weeks ago.
Since the low in March, the overall market has gone through two pretty distinct rallies with brief interruptions in June and now again at the beginning of September.Using the S&P 500 as a barometer for the overall market, we see that the index was up 44.5% from March 23 through June 8.
The sector has been trending higher over the last month as those earnings reports have been released, but many of the stocks are now in overbought territory based on their daily stochastic readings.On November 7, four of top six holdings in the VanEck Vectors Oil Services ETF (NYSE: OIH) appeared on a bearish scan that I run each night.
Tonight, the Energy Select Sector SPDR (NYSE: XLE) caught my attention, or at least the chart did.
The XLE was on a bearish scan that I run each night and as I scrolled through the charts, I couldn’t help but notice how the highs from April, July, and the last two days all connected very nicely with a downward sloped trend line.I also took it upon myself to draw a parallel line to see if the lows connected to form a trend channel.
One stock that has been trending higher in somewhat of a pattern is Royal Dutch Shell Class A Shares (NYSE: RDS/A).We see that the indicators also made bullish crossovers at the previously mentioned lows in March and May.
The Tickeron technical analysis overview shows several bullish factors that could help the stock maintain the overall trend.
At the start of 2018, Wall Street had predicted that oil prices would surpass the $100 mark in 2018 – for the first time in four years.The declines mark the first annual loss and the biggest yearly drop since 2015, when both contracts fell more than 30%.
So, what went wrong for oil?
First, following the Trump administration’s restored sanctions on Iran, fear of a supply shortage resulted into OPEC members and its allies led by Russia abandoning their 2016 agreement to restrict supply, adding about 1 million barrels per day between June and November.
Second, forecasts of a weaker than expected demand growth for oil resulted into broad stock market sell-off as investors dumped riskier assets.
The recent volatility in the oil sector has led to the Dow Jones U.S. Oil & Gas Index losing ~8% in November, thus prompting some investors to label the energy sector as cheap.Thing is, even when the energy stocks were rising owing to a rally in the oil prices earlier this year, some analysts and market observers were still labeling the sector inexpensive based on valuations.
Penalized severely by the recent oil rout, WTI futures touched their worst losing streak in nearly 34 years, while IYE -- and ETF that tracks the Dow Jones U.S. Oil & Gas Index -- suffered a year-to-date loss of ~7% and falling 15.68% below its 52-week high.
Several energy stocks trade at roughly a 50% discount to the broader market. Is the Energy sector a "buy" in these conditions?