


Credo Technology Group (CRDO): The Revolution in AI Infrastructure Fueling a 221% Increase in Stock Price
Credo Technology Group Holding Ltd (CRDO) has delivered one of the most spectacular stock performances in the semiconductor sector during the spring and summer of 2025, with shares surging an extraordinary 221% from the April 7 low of $30.08 to the July 3 close of $93.61. This remarkable rally has positioned CRDO at all-time highs, transforming what was once a relatively unknown connectivity solutions provider into a Wall Street darling riding the artificial intelligence infrastructure boom.
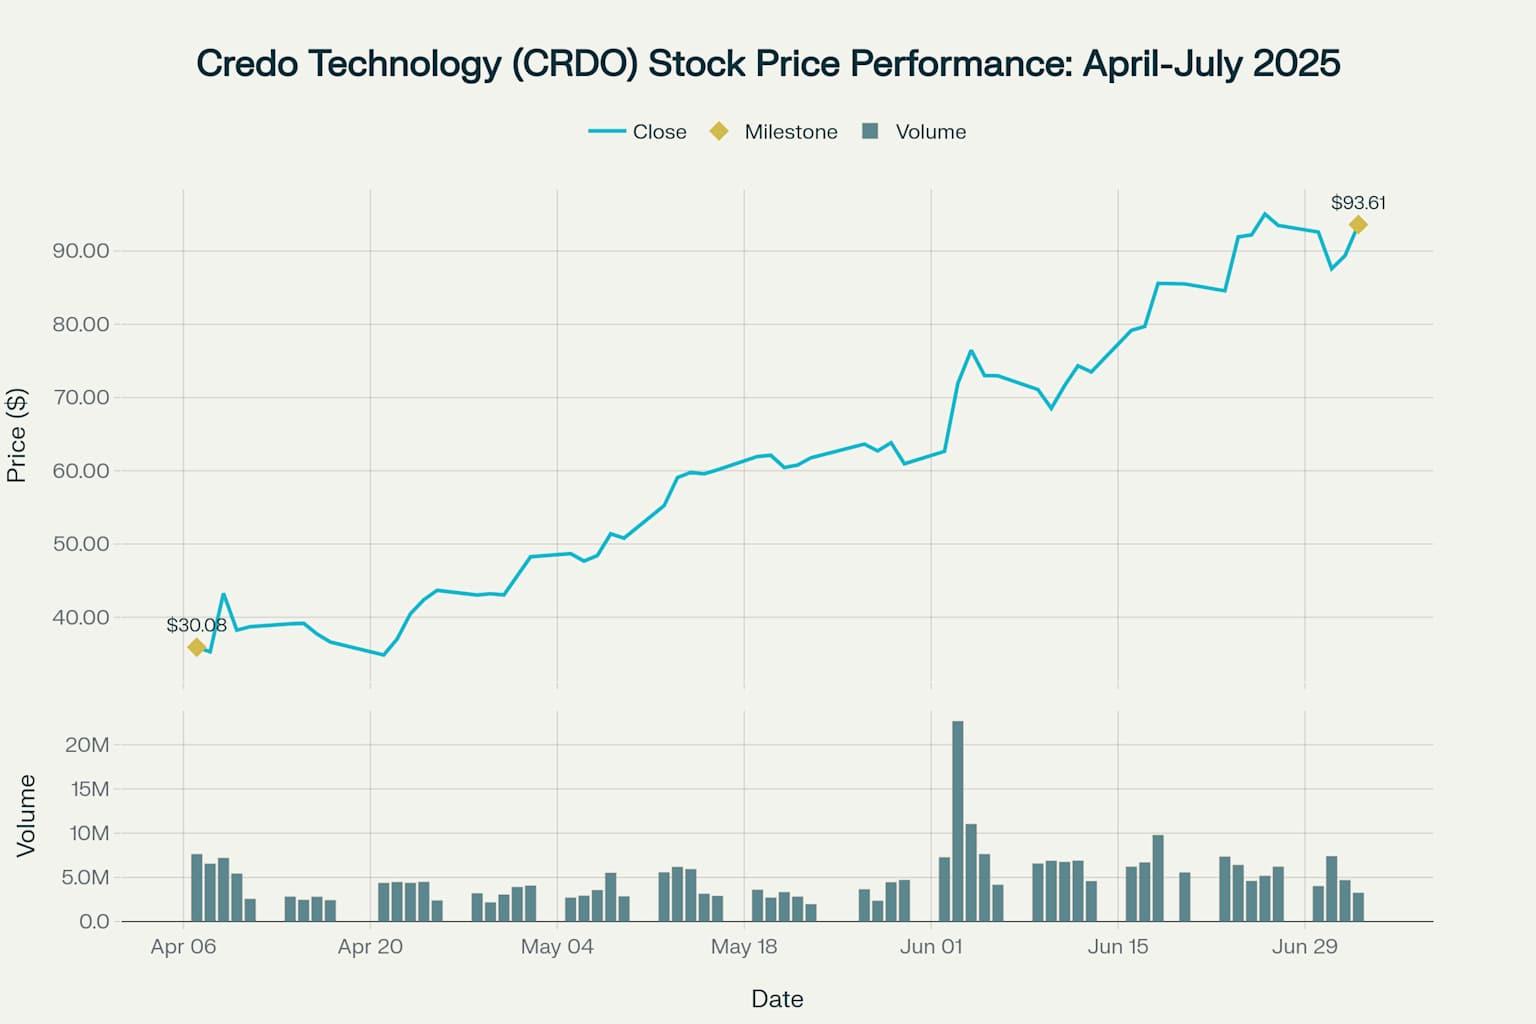
Credo Technology (CRDO) stock price performance from April to July 2025, showing the remarkable 221% surge from the April 7 low of $30.08 to the July 3 close of $93.61, driven by strong earnings results and AI infrastructure demand.
Understanding Credo Technology: The Unsung Hero of AI Infrastructure
What Credo Does: Connecting the AI Ecosystem
Credo Technology operates at the critical intersection of hardware and connectivity in the rapidly expanding AI infrastructure market. The San Jose-based company specializes in developing high-speed connectivity solutions that serve as the "connective tissue" for AI servers, data centers, and hyperscale computing environments.
The company's core mission centers on delivering breakthrough solutions that enable the next generation of AI-driven applications. Credo's product portfolio encompasses three main categories:
- Active Electrical Cables (AECs): Advanced copper cables with integrated retimer technology that provide high-speed connectivity for data centers
- Optical Digital Signal Processors (DSPs): Chips that enable optical transceivers for long-distance, high-bandwidth data transmission
- SerDes (Serializer/Deserializer) Technology: Proprietary IP and chipsets that convert parallel data streams to serial for high-speed transmission
The AI Infrastructure Imperative
Credo's solutions address a fundamental challenge in AI infrastructure: as AI models grow exponentially in size and complexity, the demand for high-speed, low-latency data transfer between GPUs, CPUs, and storage systems has become critical. The company's technologies enable multiple physical devices to work on the same AI model at high speed and low latency, making them essential for the massive AI clusters deployed by hyperscale data centers.
The scale of this opportunity is staggering. Hyperscale customers are pursuing AI/ML infrastructure that requires back-end scale-out interconnectivity densities that are an order of magnitude higher than their general compute infrastructure. Scale-up networks have grown from 8 GPUs to rack scale of 72 GPUs in 2024, with plans to expand even further.
The Earnings Catalyst: Record-Breaking Q4 2025 Results
Exceptional Financial Performance
The primary catalyst behind CRDO's meteoric rise was the company's "impressive" beat-and-raise earnings report released on June 2, 2025. The results exceeded expectations across virtually every metric:
- Q4 Revenue: $170 million (vs. $159.6 million expected), up 180% year-over-year
- Adjusted EPS: $0.35 (vs. $0.27 expected), up 400% year-over-year
- Fiscal 2025 Revenue: $436.8 million, up 126% year-over-year
The stock surged over 18% in after-hours trading immediately following the earnings announcement, with shares jumping approximately 15% in pre-market trading the following day.
Guidance Drives Continued Optimism
Perhaps more importantly than the strong Q4 results was Credo's bullish forward guidance. For Q1 fiscal 2026, the company projected revenue between $185-195 million, representing a remarkable 218% year-over-year increase at the midpoint and significantly exceeding analyst expectations of $163 million.
The company's fiscal 2026 revenue guidance of over $800 million represents more than 85% year-over-year growth, with management targeting a non-GAAP net margin approaching 40%.
Key Growth Drivers Behind the Surge
1. Explosive Demand for Active Electrical Cables
Credo's Active Electrical Cables (AECs) have emerged as a standout growth driver, with the product line posting double-digit sequential growth in Q4 2025. AECs offer several compelling advantages over traditional solutions:
- 100x improved reliability compared to laser-based optical solutions
- Up to 50% less power consumption than optical alternatives
- Up to 75% less volume than Direct Attach Cables (DACs)
- Superior cost efficiency for data center applications
The company's flagship HiWire AECs integrate retimer, gearbox, and forward error correction functionality into smaller gauge copper cables, providing a high-performance alternative to short, thick DACs and high-power, high-cost AOCs.
2. Hyperscaler Customer Momentum
Credo has established relationships with all major hyperscalers, including Microsoft, Amazon, and other leading cloud infrastructure providers. The company's Q4 results were driven by significant increases in volume of unit shipments of AEC products to hyperscaler customers, which contributed over 95% of the product sales revenue increase.
In Q4 2025, each of the company's top three customers contributed more than 10% to revenues. Management expects three to four customers to exceed 10% of revenues in upcoming quarters, driven by increasing volumes from existing hyperscalers and the expected ramp-up of two new hyperscale customers in the second half of fiscal 2026.
3. Optical DSP Business Expansion
Momentum in Credo's optical business, particularly for Optical Digital Signal Processors (DSPs), has been a key growth engine. The company achieved revenue targets for this business in fiscal 2025 and expects expansion of customer diversity across lane rates, port speeds and applications to accelerate revenue growth.
In April 2025, Credo unveiled its new Lark family of ultra-low power 800G optical DSPs, designed specifically for the challenging power and cooling requirements of the world's largest AI data centers. The Lark 850 is optimized for 800G Linear Receive Optics (LRO) with power consumption under 10W.
4. PCIe Solutions for AI Scale-Out Networks
Credo is expanding its addressable market through PCIe solutions designed for AI scale-out and scale-up networks. The company's PCIe Gen6 retimers deliver 40dB reach and sub-7ns latency at 11W, allowing designers to extend PCIe traces while ensuring best-in-class system performance.
With demonstration of PCIe Gen6 AECs and increasing hyperscaler interest, this product line is expected to remain a growth engine going forward.
Competitive Advantages: The SerDes Technology Moat
Proprietary Technology Platform
Credo's competitive advantage stems from its foundational intellectual property in SerDes technology. The company's proprietary SerDes and DSP technologies enable it to achieve similar performance to leading competitors' products but at a lower cost and using more highly available legacy node (n-1 advantage).
This technology leadership provides several key benefits:
- Lower manufacturing costs through use of mature process nodes
- Better supply chain availability compared to cutting-edge nodes
- Superior power efficiency for given performance levels
- Faster time-to-market for new products
System-Level Approach
Unlike many competitors, Credo owns the entire stack of SerDes IP, Retimer ICs, system-level design, qualification and production. This integrated approach allows for faster innovation cycles and strong cost efficiency, giving the company a competitive edge in rapidly evolving markets.
Strategic Partnerships
Credo has established strategic partnerships with industry leaders, most notably its collaboration with Microsoft on HiWire Switch AEC and open-source implementation. This partnership helps realize Microsoft's vision for highly reliable network-managed dual-Top-of-Rack (ToR) architecture, providing Credo with validation and market credibility.
Financial Transformation: From Losses to Profitability
Dramatic Financial Turnaround
One of the most impressive aspects of Credo's recent performance has been its transition from losses to strong profitability. The company achieved several financial milestones in fiscal 2025:
- Net Income: $52.2 million in fiscal 2025 vs. -$28.4 million loss in fiscal 2024
- Gross Margin: 65% for fiscal 2025, demonstrating strong pricing power
- Operating Leverage: Significant improvement in operating efficiency as revenue scaled
Strong Balance Sheet
Credo maintains a robust financial position with $431.3 million in cash and short-term investments as of Q4 2025. The company generated $57.8 million in operating cash flow during Q4, with free cash flow of $54.2 million.
Analyst Sentiment: Wall Street Embraces the Story
Price Target Upgrades
The strong Q4 results triggered a wave of analyst upgrades and price target increases:
- Susquehanna: Raised price target from $60 to $90 (50% increase) while maintaining "Positive" rating
- Mizuho: Increased price target from $81 to $98 (21% increase) with "Outperform" rating
- Roth Capital: Set new price target at $95
- Needham & Company: Raised target from $80 to $85 with "Buy" rating
Consensus Outlook
Based on analyst coverage, CRDO maintains strong Wall Street support:
- 12 Buy ratings and 1 Strong Buy among covering analysts
- Average price target of $82.43 with a high estimate of $98
- Median price target of $85 among recent analyst updates
Market Context: The AI Infrastructure Boom
Hyperscaler Capital Expenditure Surge
Credo's growth is directly tied to the massive capital expenditure programs of hyperscale data center operators. Key customers are investing heavily in AI infrastructure:
- Amazon: Plans over $100 billion in infrastructure investment for 2025
- Microsoft: Expects 2025 capex to reach $80 billion
- Tesla: Significant AI infrastructure investments for autonomous driving and robotics
Market Size and Growth
The data infrastructure market served by Credo is experiencing unprecedented growth driven by several factors:
- AI/ML model sizes driving explosion in interconnectivity traffic
- Hyperscaler general compute traffic doubling every 2-3 years
- Front-end NIC speeds increasing from 200G to 400G and beyond
Competitive Landscape: David vs. Goliath
Major Competitors
Credo competes against significantly larger semiconductor companies:
- Broadcom (AVGO): Market cap over $600 billion, broad portfolio of connectivity solutions
- Marvell Technology (MRVL): Established player in data infrastructure with $50+ billion market cap
- Intel: Massive resources and broad product portfolio
Competitive Positioning
Despite facing much larger competitors, Credo has carved out a strong niche through:
- Specialized focus on high-speed connectivity for AI and data centers
- Agility and responsiveness to customer needs
- Cost-effective solutions using mature process nodes
- Strong customer relationships with hyperscalers
Risk Factors and Challenges
Customer Concentration Risk
Credo derives a significant portion of revenue from a limited number of large customers. Any reduction in demand from major hyperscalers could significantly impact financial results, as occurred in early 2023 when the company's largest customer reduced demand forecasts.
Intense Competition
The company faces competition from much larger players with greater resources and broader product portfolios. Maintaining technological leadership against well-funded competitors represents an ongoing challenge.
Valuation Concerns
With CRDO trading at a P/S ratio of 15.16 (nearly double the sector average), some analysts question whether the current valuation adequately reflects execution risks. The stock's dramatic run-up has created high expectations for continued growth.
Supply Chain and Manufacturing Risks
As a fabless semiconductor company, Credo relies on third-party manufacturers for production. Any disruptions to key suppliers or manufacturing partners could impact product availability and margins.
Future Outlook: Sustainable Growth or Overvaluation?
Management's Long-Term Vision
CEO Bill Brennan has outlined an ambitious growth trajectory, targeting fiscal 2026 revenue exceeding $800 million (85%+ growth) with non-GAAP net margins approaching 40%. Key growth drivers include:
- Transition to 100G per lane solutions with higher margins
- Expansion into new hyperscaler customers ramping in H2 2026
- Software enablement through the PILOT platform for recurring revenue
- Advanced product roadmap including 3nm chip designs and 300G optical DSPs
Technology Roadmap
Credo continues investing heavily in R&D, spending $146 million in fiscal 2025 (33% of revenue). Key development areas include:
- Next-generation SerDes architectures for higher speeds
- Advanced DSP technologies for 800G and 1.6T applications
- PCIe Gen6 and beyond for AI scale-out networks
- Software-defined connectivity solutions
Market Opportunity
The total addressable market for high-speed connectivity solutions continues expanding as AI adoption accelerates. Key growth vectors include:
- AI infrastructure deployments by hyperscalers
- 5G wireless infrastructure buildouts
- Enterprise data center upgrades for AI workloads
- Automotive and industrial AI applications
Investment Thesis: Riding the AI Infrastructure Wave
Bull Case
Credo represents a pure-play investment in the AI infrastructure buildout with several compelling attributes:
- Mission-Critical Technology: Credo's solutions are essential for enabling AI workloads at scale
- Strong Customer Relationships: Deep partnerships with all major hyperscalers provide visibility and stability
- Technology Leadership: Proprietary SerDes IP creates competitive moats and pricing power
- Financial Momentum: Strong transition to profitability with expanding margins
- Market Tailwinds: Massive AI infrastructure investments driving multi-year growth cycle
Bear Case
Several factors could challenge Credo's continued outperformance:
- Valuation Risk: Current multiples reflect very high growth expectations with little margin for disappointment
- Customer Concentration: Dependence on small number of large customers creates volatility risk
- Competitive Pressure: Much larger competitors have resources to develop competing solutions
- Market Cyclicality: Semiconductor industry prone to boom-bust cycles
- Execution Risk: Rapid growth creates operational challenges and integration risks
Tickeron: AI-Powered Trading Tools for the Infrastructure Boom
As companies like Credo Technology become critical enablers of the AI revolution, platforms like Tickeron are helping traders spot opportunities born from this transformative wave. Tickeron applies advanced machine learning to analyze market behavior and generate precise trade ideas across equities, ETFs, and crypto—helping traders act with confidence in fast-evolving tech sectors.
Whether you're tracking semiconductor breakouts or AI infrastructure leaders, Tickeron offers a streamlined set of tools to enhance short-term timing and long-term positioning.
Key features include:
- AI Agents (60min / 15min / 5min): Short-term, machine learning–powered agents that generate intraday trade ideas based on evolving price dynamics.
- AI Pattern Search Engine that identifies breakout formations with high-probability targets and confidence levels.
- Trend Prediction Engine delivering entry and exit forecasts minutes after the market opens.
- Real-Time Signal Screener scanning thousands of assets with up-to-the-minute buy/sell signals.
In a market where technological breakthroughs can reshape entire industries overnight, Tickeron gives traders the analytical edge needed to stay agile and informed.
Conclusion: A Remarkable Transformation
Credo Technology's 221% stock surge from April to July 2025 reflects a fundamental transformation from a niche connectivity provider to a critical enabler of the AI revolution. The company's record-breaking financial results, strong customer relationships, and positioning in high-growth markets have created a compelling investment narrative that has captivated Wall Street.
However, with great success comes great expectations. Trading at premium valuations and facing intensifying competition from much larger players, Credo must continue executing flawlessly to justify current stock levels. The company's ability to maintain its technology leadership, expand its customer base, and scale operations will determine whether this remarkable rally represents the beginning of a long-term growth story or a spectacular but unsustainable surge.
Contributor
Financial writer and active order flow futures trader with a focus on fundamental analysis, macroeconomic factors, and equity research. I make in-depth blogs on stocks and ETFs, bridging the gap between raw market data and real-world trading decisions.
Momentum Indicator for CRDO turns positive, indicating new upward trend
CRDO saw its Momentum Indicator move above the 0 level on September 17, 2026. This is an indication that the stock could be shifting in to a new upward move. Traders may want to consider buying the stock or buying call options. Tickeron's A.I.dvisor looked at 66 similar instances where the indicator turned positive. In 61 of the 66 cases, the stock moved higher in the following days. The odds of a move higher are at 90%.

Technical Analysis (Indicators)
Bullish Trend Analysis
The RSI Oscillator points to a transition from a downward trend to an upward trend -- in cases where CRDO's RSI Oscillator exited the oversold zone, 25 of 30 resulted in an increase in price. Tickeron's analysis proposes that the odds of a continued upward trend are 83%.
The Moving Average Convergence Divergence (MACD) for CRDO just turned positive on September 21, 2026. Looking at past instances where CRDO's MACD turned positive, the stock continued to rise in 37 of 44 cases over the following month. The odds of a continued upward trend are 84%.
CRDO moved above its 50-day moving average on October 01, 2026 date and that indicates a change from a downward trend to an upward trend.
Following a +12.24% 3-day Advance, the price is estimated to grow further. Considering data from situations where CRDO advanced for three days, in 284 of 324 cases, the price rose further within the following month. The odds of a continued upward trend are 88%.
Bearish Trend Analysis
The Stochastic Oscillator may be shifting from an upward trend to a downward trend. In 47 of 58 cases where CRDO's Stochastic Oscillator exited the overbought zone, the price fell further within the following month. The odds of a continued downward trend are 81%.
Following a 3-day decline, the stock is projected to fall further. Considering past instances where CRDO declined for three days, the price rose further in 50 of 62 cases within the following month. The odds of a continued downward trend are 82%.
CRDO broke above its upper Bollinger Band on September 25, 2026. This could be a sign that the stock is set to drop as the stock moves back below the upper band and toward the middle band. You may want to consider selling the stock or exploring put options.
The Aroon Indicator for CRDO entered a downward trend on September 23, 2026. This could indicate a strong downward move is ahead for the stock. Traders may want to consider selling the stock or buying put options.
Fundamental Analysis (Ratings)
The Tickeron SMR rating for this company is 33 (best 1 - 100 worst), indicating very strong sales and a profitable business model. SMR (Sales, Margin, Return on Equity) rating is based on comparative analysis of weighted Sales, Income Margin and Return on Equity values compared against S&P 500 index constituents. The weighted SMR value is a proprietary formula developed by Tickeron and represents an overall profitability measure for a stock.
The Tickeron Price Growth Rating for this company is 37 (best 1 - 100 worst), indicating steady price growth. CRDO’s price grows at a higher rate over the last 12 months as compared to S&P 500 index constituents.
The Tickeron Valuation Rating of 72 (best 1 - 100 worst) indicates that the company is slightly overvalued in the industry. This rating compares market capitalization estimated by our proprietary formula with the current market capitalization. This rating is based on the following metrics, as compared to industry averages: P/B Ratio (13.280) is normal, around the industry mean (7.975). P/E Ratio (67.842) is within average values for comparable stocks, (165.532). Projected Growth (PEG Ratio) (0.000) is also within normal values, averaging (3.761). Dividend Yield (0.000) settles around the average of (0.007) among similar stocks. P/S Ratio (19.342) is also within normal values, averaging (45.794).
The Tickeron PE Growth Rating for this company is 97 (best 1 - 100 worst), pointing to worse than average earnings growth. The PE Growth rating is based on a comparative analysis of stock PE ratio increase over the last 12 months compared against S&P 500 index constituents.
The Tickeron Profit vs. Risk Rating rating for this company is 100 (best 1 - 100 worst), indicating that the returns do not compensate for the risks. CRDO’s unstable profits reported over time resulted in significant Drawdowns within these last five years. A stable profit reduces stock drawdown and volatility. The average Profit vs. Risk Rating rating for the industry is 73, placing this stock worse than average.
Notable companies
Industry description
Market Cap
High and low price notable news
Volume
Fundamental Analysis Ratings
The average fundamental analysis ratings, where 1 is best and 100 is worst, are as follows

Advertisement
General Information
Industry Semiconductors
Advertisement